. 2002 Apr 29;157(3):455-68.
doi: 10.1083/jcb.200109094. Epub 2002 Apr 29.

DAP kinase and DRP-1 mediate membrane blebbing and the formation of autophagic vesicles during programmed cell death

Affiliations

DAP kinase and DRP-1 mediate membrane blebbing and the formation of autophagic vesicles during programmed cell death

Boaz Inbal et al. J Cell Biol. .

Abstract

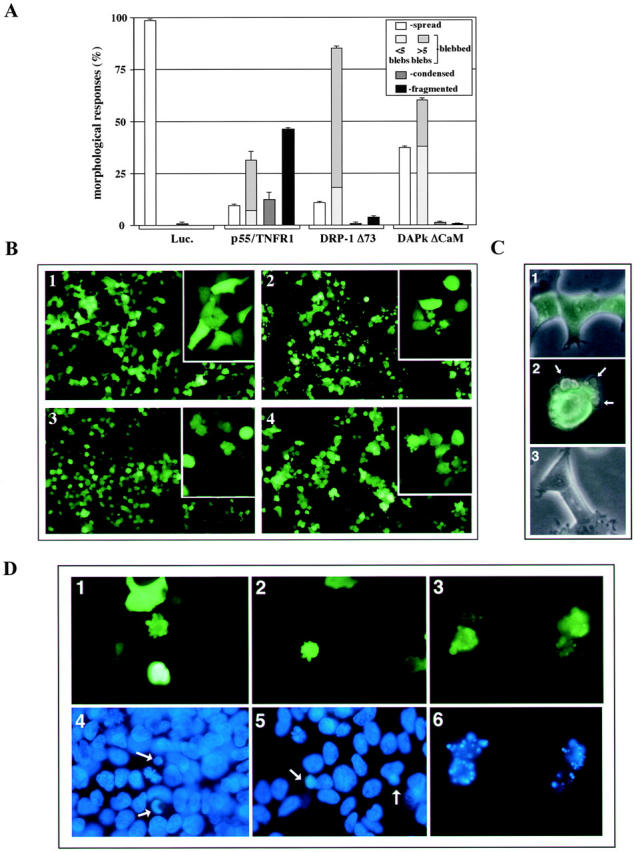
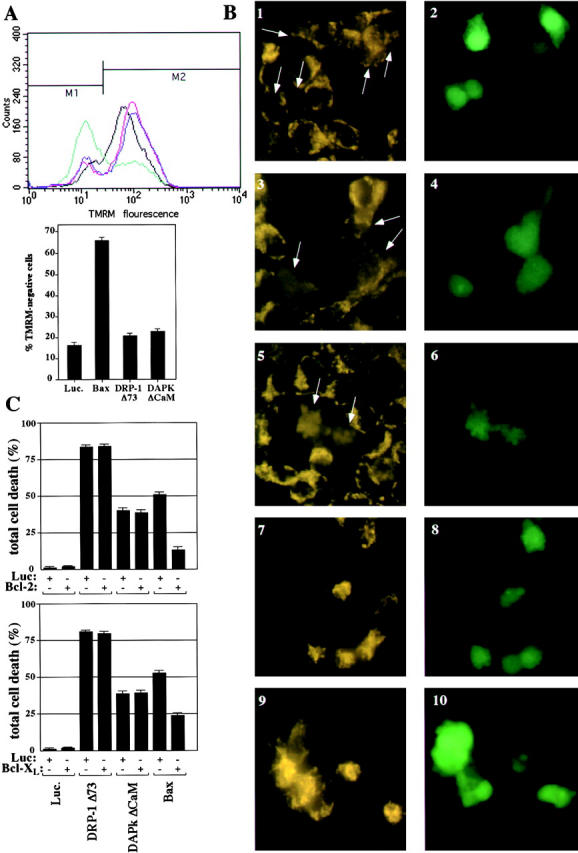
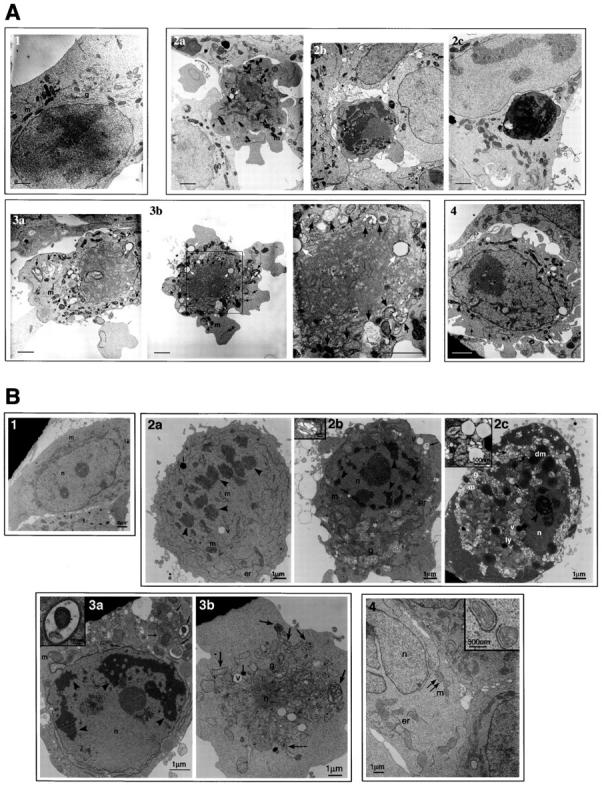
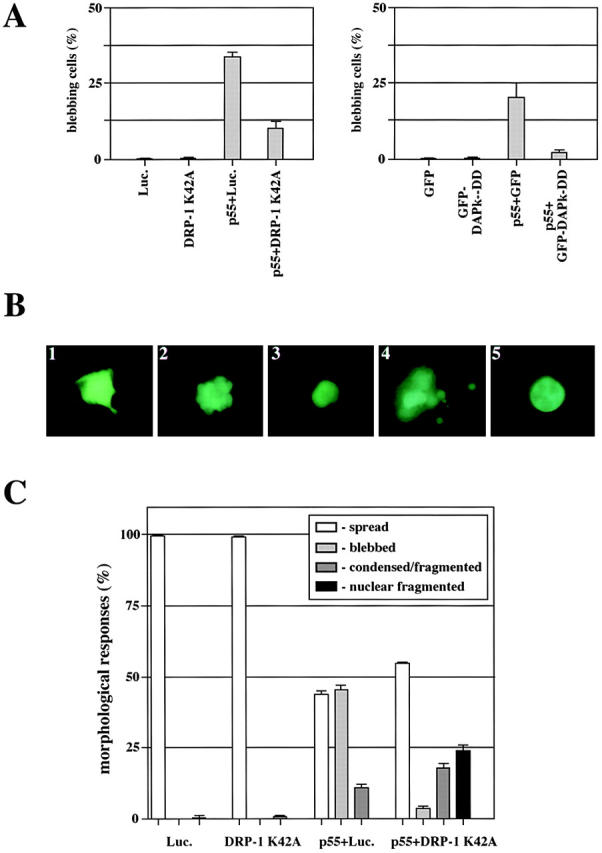
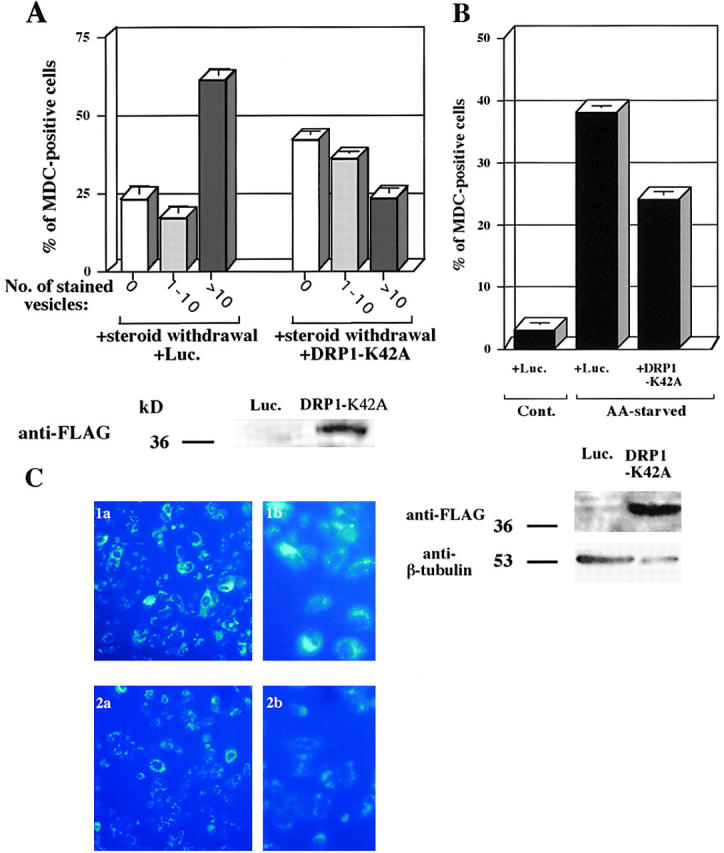
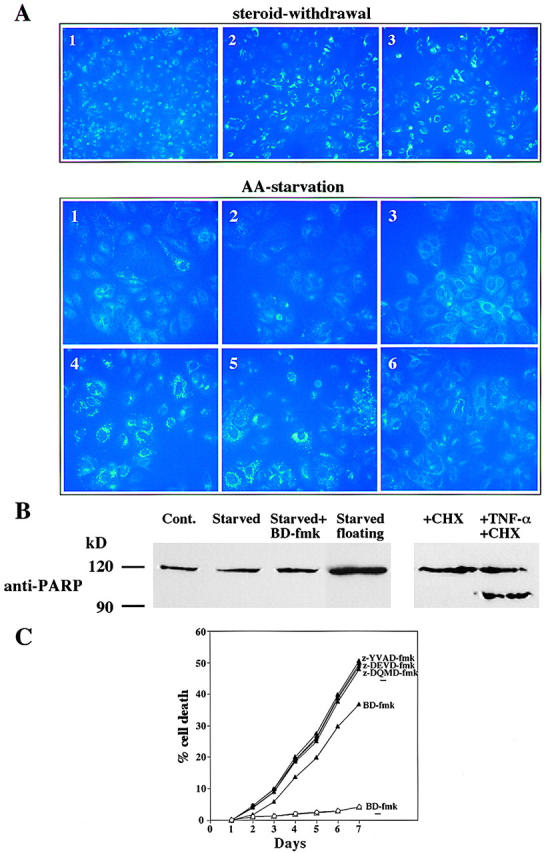
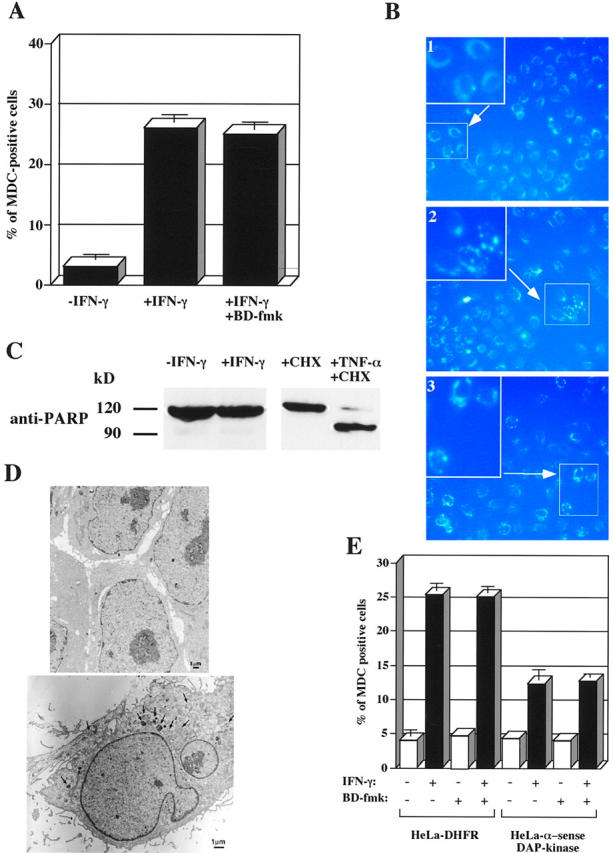
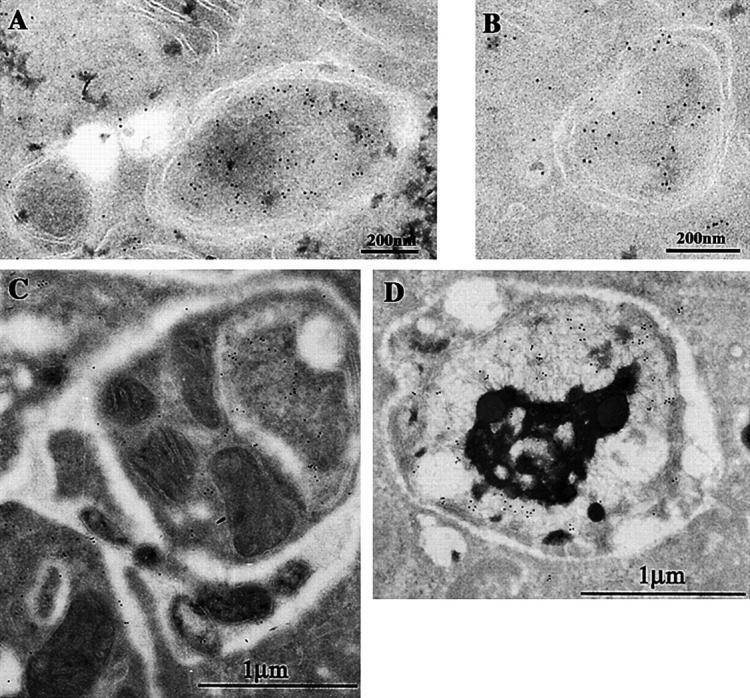
Death-associated protein kinase (DAPk) and DAPk-related protein kinase (DRP)-1 proteins are Ca+2/calmodulin-regulated Ser/Thr death kinases whose precise roles in programmed cell death are still mostly unknown. In this study, we dissected the subcellular events in which these kinases are involved during cell death. Expression of each of these DAPk subfamily members in their activated forms triggered two major cytoplasmic events: membrane blebbing, characteristic of several types of cell death, and extensive autophagy, which is typical of autophagic (type II) programmed cell death. These two different cellular outcomes were totally independent of caspase activity. It was also found that dominant negative mutants of DAPk or DRP-1 reduced membrane blebbing during the p55/tumor necrosis factor receptor 1-induced type I apoptosis but did not prevent nuclear fragmentation. In addition, expression of the dominant negative mutant of DRP-1 or of DAPk antisense mRNA reduced autophagy induced by antiestrogens, amino acid starvation, or administration of interferon-gamma. Thus, both endogenous DAPk and DRP-1 possess rate-limiting functions in these two distinct cytoplasmic events. Finally, immunogold staining showed that DRP-1 is localized inside the autophagic vesicles, suggesting a direct involvement of this kinase in the process of autophagy.


Figures

Figure 1.
Figure 1.
Morphological changes induced by DAPk family proteins. (A) Quantification of cell death in 293 cells 24 h after transfection with luciferase, p55/TNFR1, DRP-1 Δ73 or DAPk ΔCaM, and GFP. Graphs show the percentage of GFP-positive cells with altered cell morphology. (B) Photographs of GFP-positive cells cotransfected with luciferase (1), p55/TNFR1 (2), DRP-1 Δ73 (3), or DAPk ΔCaM (4). (C) Photographs showing the overlay of GFP and phase–contrast images of 293 cells 24 h after transfection with GFP and luciferase (1) or with GFP-DAPk (2 and 3); both a blebbing GFP-DAPk–expressing cell (2, arrows indicate blebs) and spread nontransfected cells are shown (3). (D) Hoechst staining (4–6) of GFP-positive 293 cells (1–3) 60 h after cotransfection with GFP and DAPk ΔCaM (1 and 4), DRP-1 Δ73 (2 and 5), or p55/TNFR1 (3 and 6). Arrows point to condensed nuclei resulting from DRP-1 Δ73 or DAPk ΔCaM transfections (4 and 5).
Figure 2.
Figure 2.
DAPk family proteins do not induce cell death via the mitochondrial pathway. (A) Scoring loss of mitochondrial membrane potential (ΔΨm). 293 cells expressing luciferase (black), DRP-1 Δ73 (pink), DAPk ΔCaM (purple), and Bax (green) were assayed for loss of mitochondrial membrane potential 24 h after transfection using flow cytometric analysis of TMRM fluorescence. The fraction of TMRM-negative cells calculated from three experiments is shown in the graph below. The small increase in TMRM fluorescence in the kinase-transfected cells is not statistically significant. (B) Scoring the release of cytochrome C from mitochondria. 293 cells cotransfected with luciferase (1 and 2), Bax (3 and 6), DRP-1 Δ73 (7 and 8), or DAPk ΔCaM (9 and 10) and GFP constructs were incubated for 24 h and immunostained using anti–cytochrome C antibodies. Cells were visualized for cytochrome C (left) or GFP (right) fluorescence. Bax-transfected spread (3 and 4) or blebbed (5 and 6) cells are shown. In fields that also contain nontransfected cells, arrows point to GFP-positive cytochrome C–stained cells. (C) Assessing the effects of Bcl-2 and Bcl-XL. 293 cells were cotransfected with luciferase, DRP-1 Δ73, DAPk ΔCaM, or Bax, and either Bcl-2 or Bcl-XL together with GFP. GFP-positive cells were visualized by fluorescent microscopy and scored for the appearance of cell death morphology 24 h after transfection. Total cell death refers to the sum of all morphological changes observed.
Figure 3.
Figure 3.
High resolution morphology of DAPk family protein-induced cell death. (A) Transmission electron micrographs of 293 cells transfected with luciferase (1) p55/TNFR1 (2a–2c), DRP-1 Δ73 (3a and 3b; part of fig. 3b is magnified on its right), and DAPk ΔCaM (4). The different stages of autophagic development are depicted as follows: immature autophagic vesicles (double arrow), mature autophagic vesicles and autolysosomes (black arrow), and residual bodies (dashed arrow). Empty vacuoles (white arrow) are also shown. Arrowheads show condensed and fragmented chromatin. m, mitochondria; g, Golgi apparatus. Bar, 1 μm. (B) Transmission electron micrographs of MCF-7 cells transfected with luciferase (1), p55/TNFR1 (2a–2c), DRP-1 Δ73 (3a and 3b), and DAPk ΔCaM (4). Immature autophagic vesicles (double arrow), autophagic vesicles (black arrow), and residual bodies (dashed arrow) are shown. Insets in B, 2b and 2c, correspond to empty vacuoles, whereas those in B, 3a and 4, correspond to autophagic vesicles. Arrowheads show condensed and fragmented chromatin. m, mitochondria; dm, darkened mitochondria; n, nucleus; g, Golgi apparatus; v, vacuoles; ly, lysosomes; er, endoplasmic reticulum.
Figure 4.
Figure 4.
DRP-1 induces autophagy in various cell lines. (A) Quantification of autophagy in 293 and MCF-7 cells. Graphs show the percentage of MDC-positive cells resulting from luciferase or DRP-1 Δ73 transfections (mean ± SD calculated from triplicates of 100 cells each; note that total cell number comprises transfected and nontransfected cells). These experiments were repeated three times with reproducible results. (B) Photographs of MDC-stained MCF-7 cells from the same experiment shown in A. Arrows point to MDC-positive cells. Transfections: luciferase (1a and 1b) and DRP-1 Δ73 (2a and 2b) at low (a) and high (b) magnifications.
Figure 5.
Figure 5.
DAPk family proteins induce caspase-independent cell death in various cell lines. (A) Quantification of cell death-associated morphologies in 293 cells. Graphs show the percentage of cells harboring all spectrum of morphological changes occurring as a result of luciferase, p55/TNFR1, DRP-1 Δ73, or DAPk ΔCaM transfections in the presence or absence of the caspase inhibitors BD-fmk or z-VAD-fmk (100 μM; mean ± SD calculated from triplicates of 100 cells each). This experiment was repeated three times with reproducible results. (B) Quantification of cell death-associated morphologies in MCF-7 cells. Experimental conditions were performed as in A in the presence or absence of BD-fmk (100 μM). (C) Graphs show the percentage of cells harboring the complete spectrum of death-associated morphological changes occurring as a result of cotransfections of luciferase, p55/TNFR1, DRP-1 Δ73, or DAPk ΔCaM with the caspase inhibitor crmA or control luciferase vector (mean ± SD calculated from triplicates of 100 cells each). Immunoblot shows the expression levels of transfected HA-tagged DAPk and DRP-1 Δ73, confirming that cotransfection with crmA did not alter expression of the death-inducing proteins. (D) Transmission electron micrographs of 293 cells transfected with p55/TNFR1 (1) or DRP-1 Δ73 (2a and 2b; parts of these figures are magnified at the right) and treated with the caspase inhibitor BD-fmk (100 μM). Immature autophagic vesicles (double arrow), autophagic vesicles (black arrow), and autolysosomes (white arrow) are shown. m, mitochondria; g, Golgi apparatus. (E) Western blots of cell lysates prepared from HeLa cells transfected with luciferase, p55/TNFR1, DRP-1 Δ73, or DAPk ΔCaM and GFP and incubated for 24 h. Blots were reacted with anti-PARP antibodies, anti–caspase-8 antibodies, anti–caspase-3 antibodies, anti-HA antibodies for DRP-1 Δ73 and DAPk ΔCaM detection, and anti–β-tubulin antibodies to quantitate protein loading.
Figure 6.
Figure 6.
DRP-1 and DAPk dominant negative mutants reduce membrane blebbing resulting from p55/TNFR1 transfections in 293 cells. (A) 293 cells were cotransfected with p55/TNFR1 in combination with DAPk death domain fused to GFP or DRP-1 K42A and pEGFP-N1 vector. A control luciferase vector was also used. GFP-positive cells were visualized by fluorescent microscopy and scored for the appearance of membrane blebbing 24 h after transfection. (B) Photographs of the various categories of p55/TNFR1-transfected 293 cells: spread cells (1), blebbed cells (2), condensed cells (3), cells displaying a fragmented cytoplasm (4), and cells carrying fragmented nuclei within a noncondensed cytoplasm (5). (C) Quantification of each death morphology observed 24 h after transfection with GFP, p55/TNFR1, and either luciferase or DRP-1 K42A.
Figure 7.
Figure 7.
DRP-1 K42A protects from autophagy induced by steroid withdrawal and amino acid starvation. (A and B). Quantification of autophagy in MCF-7 cells. MCF-7 cells were transfected with luciferase or FLAG–DRP-1 K42A followed by steroid withdrawal (serum starvation plus 10−6 M tamoxifen treatment) (A) or by serum and amino acid starvation (B) (mean ± SD calculated from triplicates of 100 cells each). These experiments were repeated three times with reproducible results. Proteins extracted from the transfected cells were subjected to Western blot analysis with anti-FLAG and anti–β-tubulin antibodies. (C) Photographs of the MDC-stained steroid withdrawn MCF-7 cells taken from the same experiment shown in A. Transfections: luciferase (1a and 1b) and DRP-1 K42A (2a and 2b) at low (a) and high (b) magnifications.
Figure 8.
Figure 8.
Autophagy induced by steroid withdrawal or by amino acid starvation is insensitive to caspase inhibitors. (A) Photographs of MDC-stained MCF-7 cells. (Top) Steroid withdrawal. Cells were either grown in complete medium (1), steroid depleted (2), or steroid depleted in the presence of the broad caspase inhibitor BD-fmk (100 μM) (3) for 3 d. (Bottom) amino acid starvation. Cells were either grown in complete medium (1–3) or under amino acid starvation condition (4–6) without (1 and 4) or with (2 and 5) the presence of the broad caspase inhibitor BD-fmk (100 μM) or the general inhibitor of autophagy 3-methyladenine (10 mM) (3 and 6) for 3 d. (B) PARP cleavage in MCF-7–starved cells. Proteins extracted from 4-d steroid-depleted (left) or 12-h TNF–α-treated (100 ng/ml) cells (right) were subjected to Western blot analysis with anti-PARP antibodies. The proteins were prepared from the same experiment shown in A. (C) Graph showing the cumulative phase microscopy scores of dead (shrunk and detached) MCF-7 cells in tamoxifen-treated (filled) or nontreated (unfilled) cultures in the presence (▴) or absence (•) of the indicated caspase inhibitors (25 μM).
Figure 9.
Figure 9.
DAPk antisense RNA protects from IFN-γ–induced autophagy of HeLa cells. (A) Quantitation of autophagy in HeLa cells. Cells were either grown in complete medium (1), treated with IFN-γ (1,000 U/ml) (2), or treated with IFN-γ in the presence of the broad caspase inhibitor BD-fmk (100 μM) (3) for 3 d. (B) Photographs of the MDC-stained HeLa cells corresponding to the experiment in A. Treatments: complete medium (1), IFN-γ (1,000 U/ml) (2), and IFN-γ (1,000 U/ml) + BD-fmk (3). (C) PARP cleavage in HeLa IFN-γ–treated cells. Proteins extracted from IFN-γ–treated (left) or TNF-α–treated (100 ng/ml) cells (right) were subjected to Western blot analysis with anti-PARP antibodies. The proteins were prepared from the same experiment shown in A. (D) Transmission electron micrographs of nontreated (top) and IFN-γ–treated (bottom) HeLa cells. Arrows point to autophagic vesicles. (E) DAPk antisense-transfected and control DHFR-transfected polyclonal populations of HeLa cells were incubated with hygromycin B (200 μg/ml) in the presence or absence of IFN-γ (1,000 U/ml) and BD-fmk (50 μM). Detection of autophagic vesicles was performed 2 d later using the MDC dye. Graphs represent mean ± SD of MDC-positive cells calculated from triplicates of 100 cells each.
Figure 10.
Figure 10.
DRP-1 is localized to the lumen of autophagic vesicles. Immunogold staining of 293 cells expressing HA–DRP-1 reveals a specific staining of DRP-1 in the lumen of double membrane autophagosomes containing cytoplasmic material (A and B) in autophagosomes containing organelles and vacuoles (C) and inside the body of autolysosomes containing digested matter (D). The gold particles do not overlap with the phagocytosed organelles in C or the lysosomes in D.

References

    1. Anglade, P., S. Vyas, F. Javoy-Agid, M.T. Herrero, P.P. Michel, J. Marquez, A. Mouatt-Prigent, M. Ruberg, E.C. Hirsch, and Y. Agid. 1997. Apoptosis and autophagy in nigral neurons of patients with Parkinson's disease. Histol. Histopathol. 12:25–31. - PubMed
    1. Biederbick, A., H.F. Kern, and H.P. Elsasser. 1995. Monodansylcadaverine (MDC) is a specific in vivo marker for autophagic vacuoles. Eur. J. Cell Biol. 66:3–14. - PubMed
    1. Bursch, W., A. Ellinger, H. Kienzl, L. Torok, S. Pandey, M. Sikorska, R. Walker, and R.S. Hermann. 1996. Active cell death induced by the anti-estrogens tamoxifen and ICI 164 384 in human mammary carcinoma cells (MCF-7) in culture: the role of autophagy. Carcinogenesis. 17:1595–1607. - PubMed
    1. Bursch, W., K. Hochegger, L. Torok, B. Marian, A. Ellinger, and R.S. Hermann. 2000. Autophagic and apoptotic types of programmed cell death exhibit different fates of cytoskeletal filaments. J. Cell Sci. 113:1189–1198. - PubMed
    1. Cataldo, A.M., D.J. Hamilton, and R.A. Nixon. 1994. Lysosomal abnormalities in degenerating neurons link neuronal compromise to senile plaque development in Alzheimer disease. Brain Res. 640:68–80. - PubMed

Publication types

MeSH terms