. 2002 May;119(5):427-42.
doi: 10.1085/jgp.20028559.

Effects of aldosterone on biosynthesis, traffic, and functional expression of epithelial sodium channels in A6 cells

Affiliations

Effects of aldosterone on biosynthesis, traffic, and functional expression of epithelial sodium channels in A6 cells

Diego Alvarez de la Rosa et al. J Gen Physiol. 2002 May.

Abstract

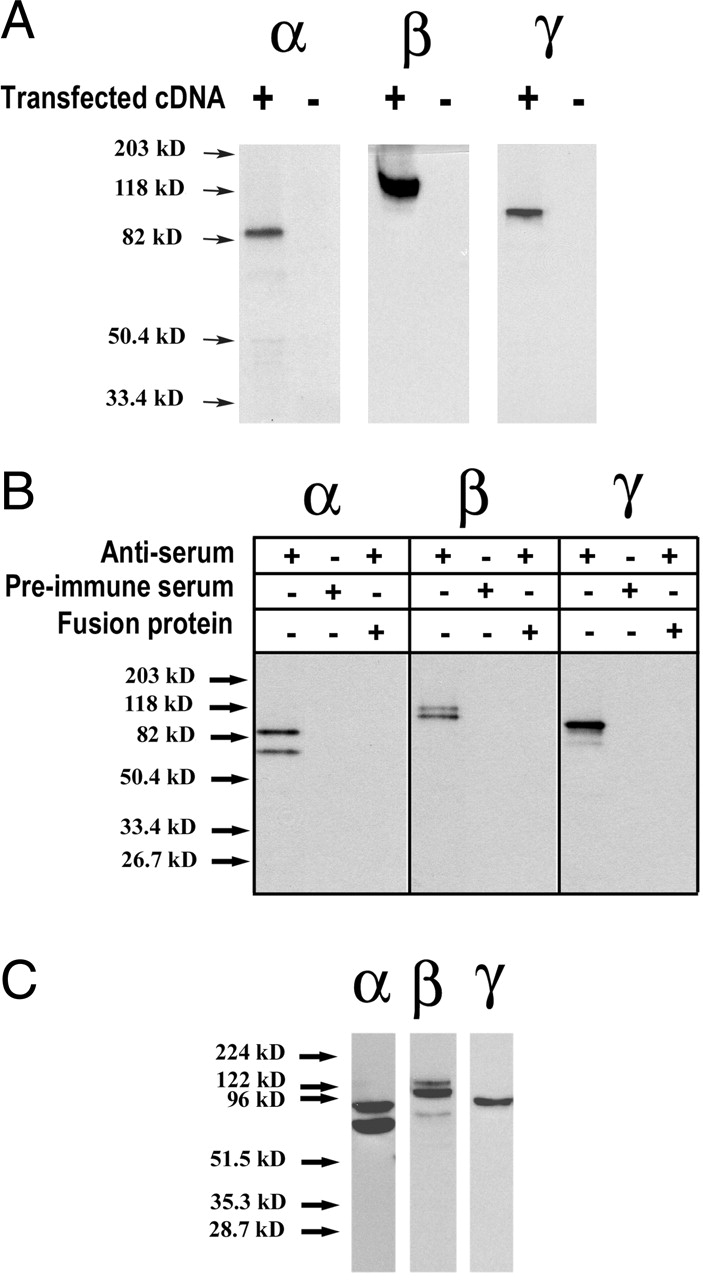
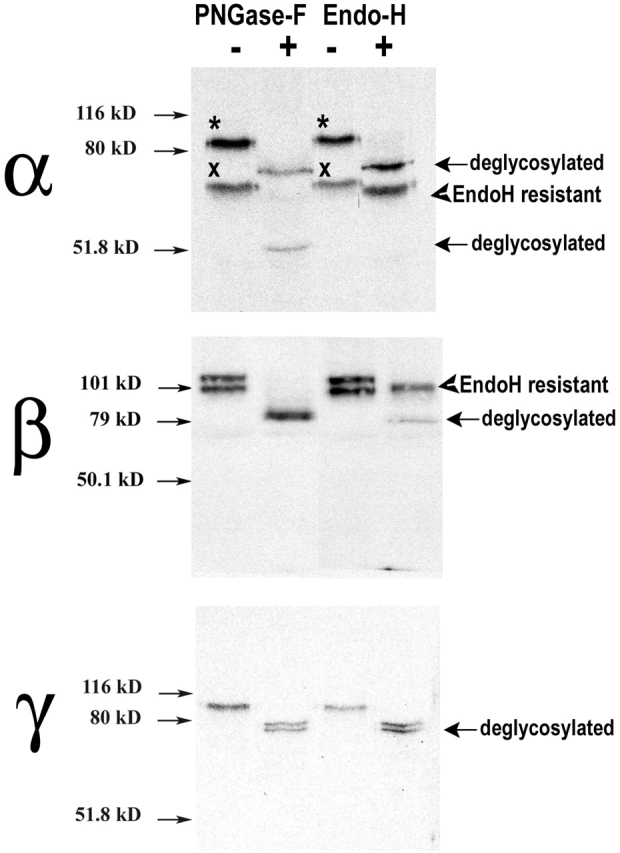
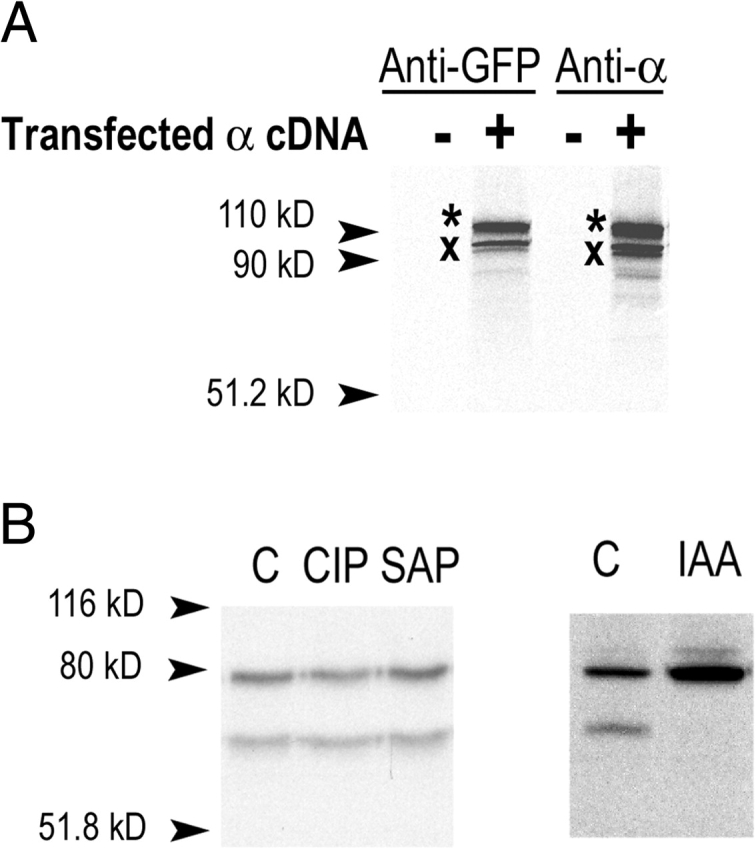
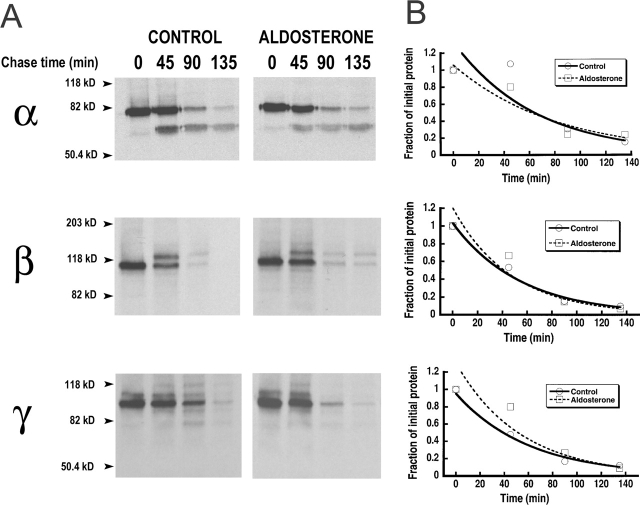
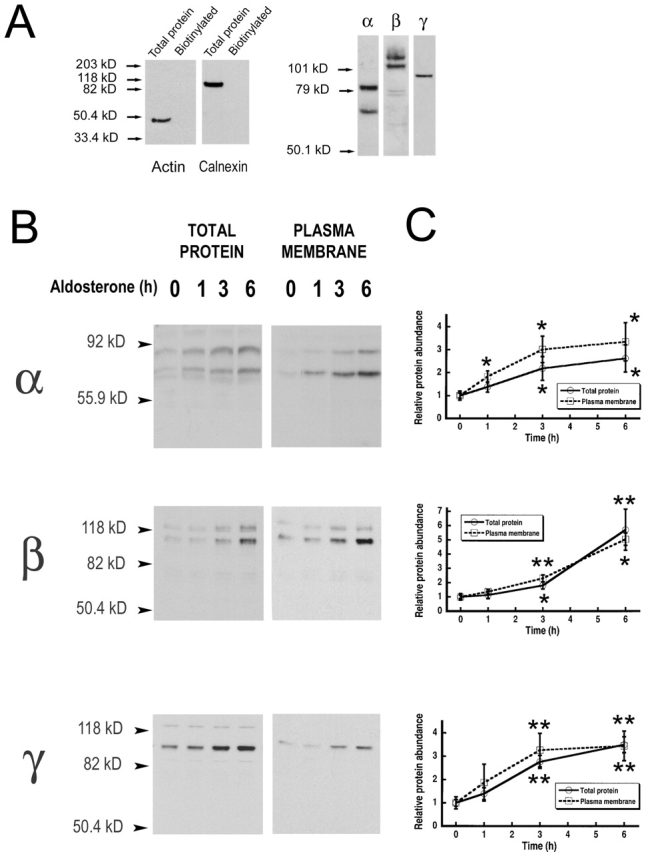
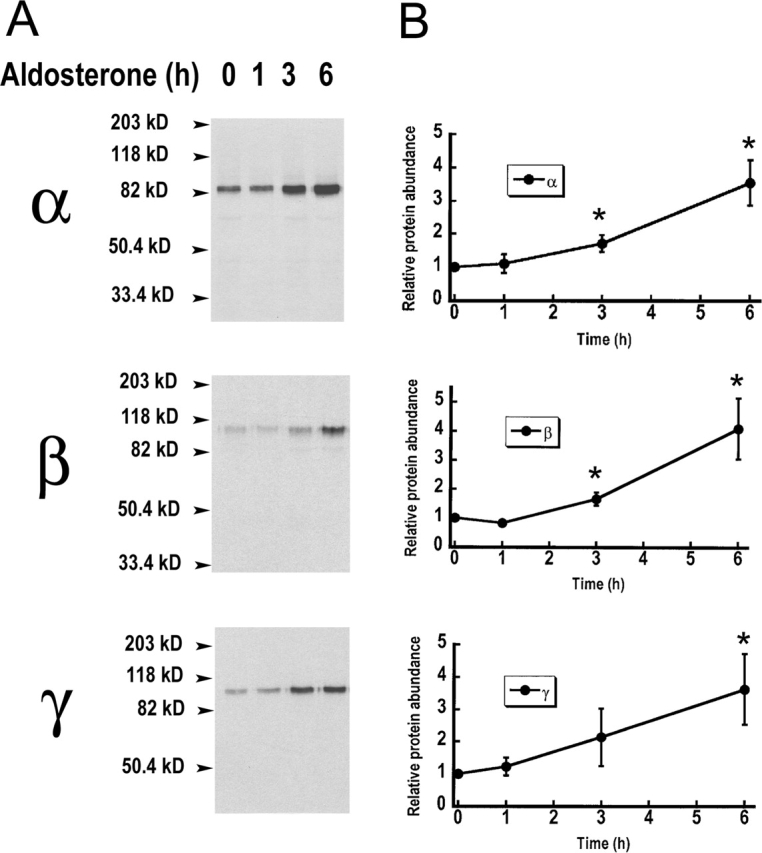
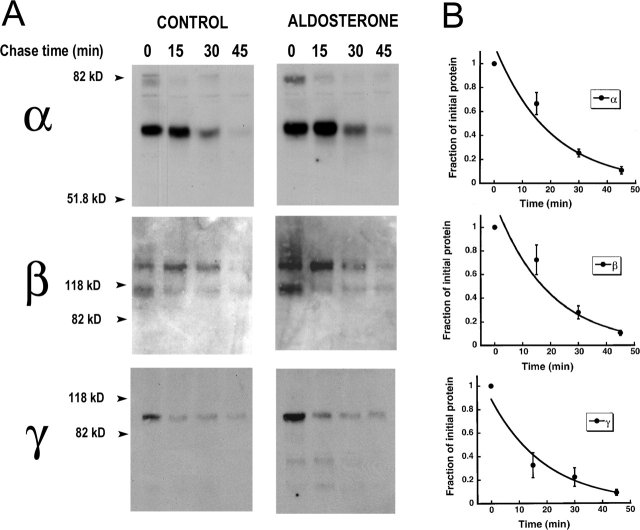
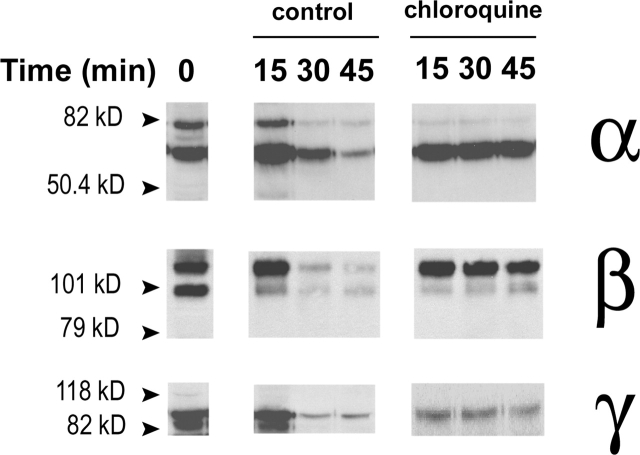
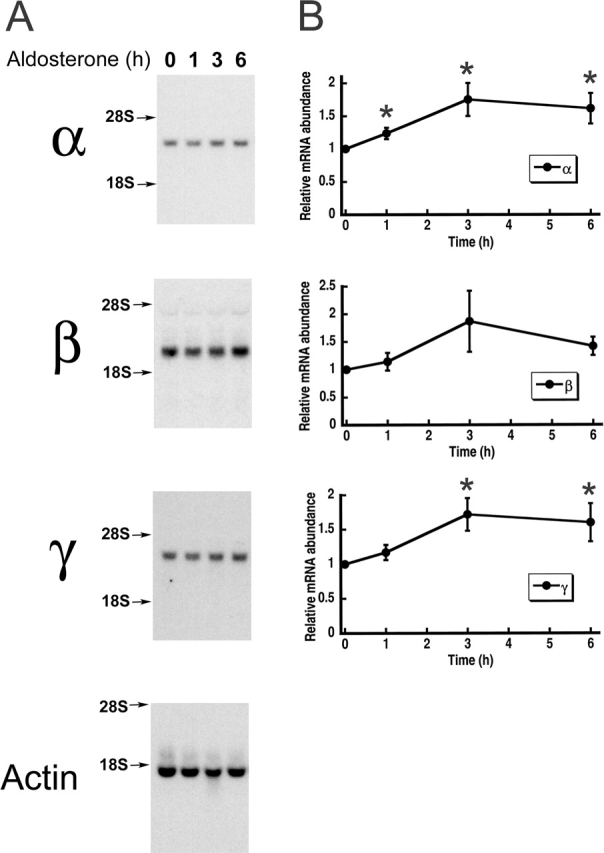
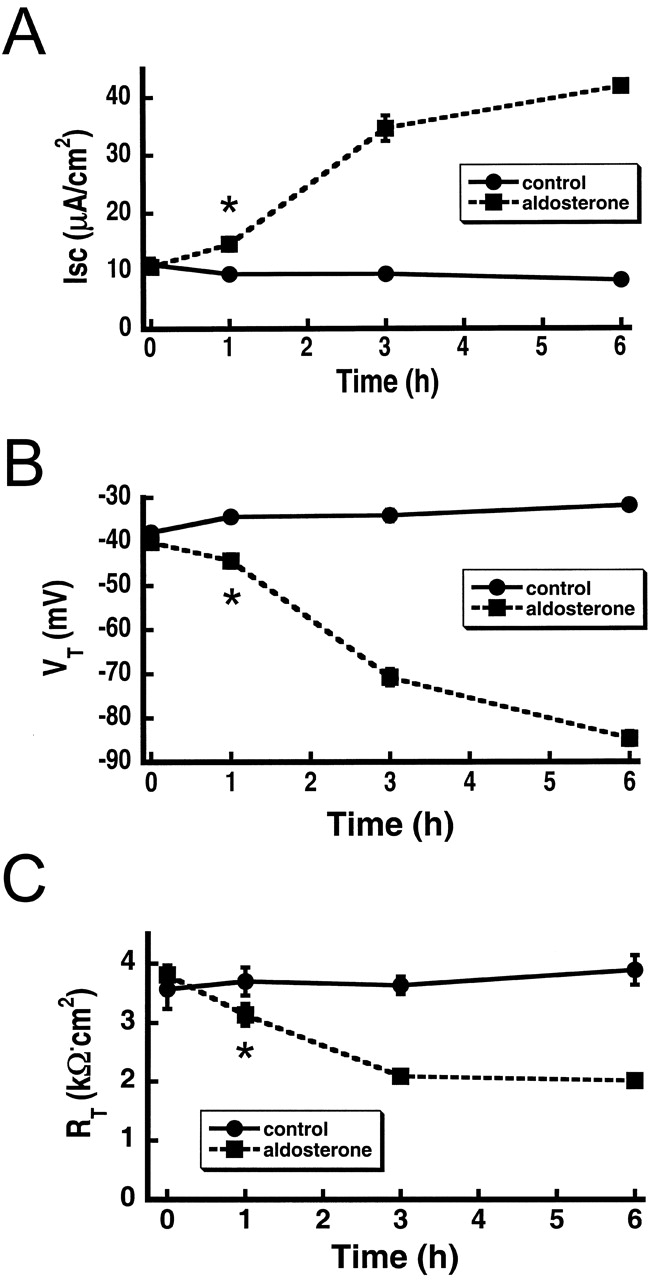
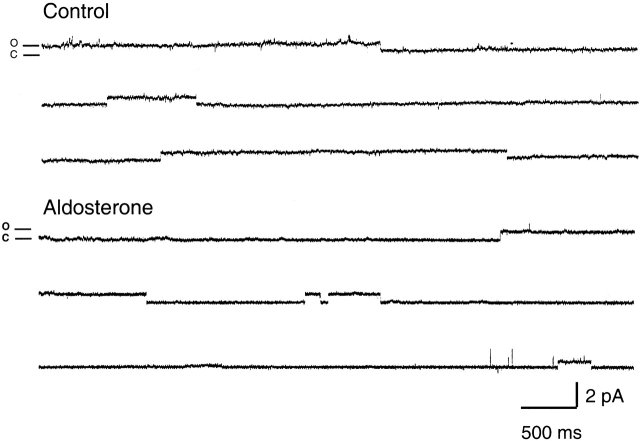
The collecting duct regulates Na(+) transport by adjusting the abundance/activity of epithelial Na(+) channels (ENaC). In this study we have investigated the synthesis, degradation, endocytosis, and activity of ENaC and the effects of aldosterone on these processes using endogenous channels expressed in the A6 cell line. Biochemical studies were performed with a newly raised set of specific antibodies against each of the three subunits of the amphibian ENaC. Our results indicate simultaneous transcription and translation of alpha, beta, and gamma subunits and enhancement of both processes by aldosterone: two- and fourfold increase, respectively. The biosynthesis of new channels can be followed by acquisition of endoglycosidase H-resistant oligosacharides in alpha and beta subunits and, in the case of alpha, by the appearance of a form resistant to reducing agents. The half-life of the total pool of subunits (t(1/2) 40-70 min) is longer than the fraction of channels in the apical membrane (t(1/2) 12-17 min). Aldosterone induces a fourfold increase in the abundance of the three subunits in the apical membrane without significant changes in the open probability, kinetics of single channels, or in the rate of degradation of ENaC subunits. Accordingly, the aldosterone response could be accounted by an increase in the abundance of apical channels due, at least in part, to de novo synthesis of subunits.


Figures

F<sc>igure</sc> 1.
Figure 1.
Antibody characterization and recognition of endogenously expressed ENaC in A6 cells. (A) A6 cells grown on plastic were transiently transfected with plasmid constructs containing α, β, or γ ENaC subunits. Cells were pulse-labeled for 15 min with [35S]-methionine and [35S]-cysteine and each subunit was immunoprecipitated with anti-Xenopus ENaC antibodies. Negative controls of mock-transfected cells were included in each experiment. (B) Polarized A6 cells grown on filters were [35S]-labeled for 2 h and endogenous ENaC subunits were immunoprecipitated with anti-Xenopus ENaC antibodies. Controls, including the immunogenic fusion proteins or with preimmune serums, are also shown. (C) Microsomal proteins from A6 cells grown on filters were resolved on a 10% SDS-PAGE, transferred to membranes, and detected with the specific xENaC antibodies by Western blots.
F<sc>igure</sc> 2.
Figure 2.
Glycosylation of ENaC subunits. A6 cells grown on filters were metabolically labeled for 2 h and α, β, and γ subunits were immunoprecipitated with the corresponding specific antibody. Parallel samples were treated with PNGase-F or Endo-H. Deglycosylated bands are indicated with arrows. Arrowheads point to endo-H–resistant bands. Asterisks mark the slower migrating bands and crosses mark the faster migrating bands of the α subunit.
F<sc>igure</sc> 3.
Figure 3.
Maturation of xENaC α subunit. (A) A6 cells grown on plastic were transiently transfected with a plasmid construct expressing a GFP-αENaC fusion protein. Cells were metabolically labeled for 2 h and the recombinant protein was immunoprecipitated with antibodies against α COOH terminus or against GFP. Negative controls of mock-transfected cells are shown. (B) Endogenously expressed αENaC in A6 cells grown on permeable supports was immunoprecipitated and treated with phosphatases CIP or SAP. Independently, cells were treated with IAA. The slower migrating band of the α subunit disappeared after treatment with IAA.
F<sc>igure</sc> 6.
Figure 6.
Turnover of the total cellular pool of ENaC subunits without and with aldosterone. (A) Control cells or cells pretreated with aldosterone for 6 h were pulse-labeled with [35S]-methionine and [35S]-cysteine for 30 min and then chased with cold medium for the indicated periods of time (minutes). α, β, and γ subunits were immunoprecipitated from the lysates and resolved on SDS-PAGE. A representative autoradiograph of each subunit is shown. (B) Scanning densitometry values from autoradiographs shown in A. Values were normalized to the 0 time-point.
F<sc>igure</sc> 4.
Figure 4.
Steady-state levels of total and cell surface ENaC subunits. (A) A6 cells apical plasma membrane proteins were biotinylated, recovered from cell lysates with streptavidine beads, and analyzed by Western blot with antibodies against actin, calnexin, and xENaC subunits. Actin and calnexin blots include a lane with an extract of total proteins and a lane with biotinylated protein. (B) A6 cells were treated for indicated times with 100 nM aldosterone followed by apical biotinylation. Aliquots of cell lysates containing 20 μg of protein were analyzed by Western blot with anti–xENaC antibodies (total protein). Biotinylated proteins were recovered with streptavidine-agarose beads and analyzed by Western blot (plasma membrane). Representative experiments are shown for each subunit. (B) Time course of the change in abundance of total (circles) and surface (squares) subunits examined by scanning densitometry. Each data point represents the mean ± SE of five experiments. Student's t tests were used to compare the value at each time point with the value at 0 h. Asterisks above dotted line refer to plasma membrane values. Asterisks below solid line refer to total protein values. *, P < 0.05; **, P < 0.01.
F<sc>igure</sc> 5.
Figure 5.
Aldosterone effects on the rate of synthesis of ENaC subunits. (A) A6 cells grown on filters were pretreated with 100 nM aldosterone for the indicated periods of time (in hours). Cells were then metabolically radiolabeled for 15 min and ENaC subunits were immunoprecipitated. A representative example for α, β, and γ subunits is shown. (B) Graphs represent the time course of the rate of synthesis of subunits in the presence of aldosterone. Values were normalized to the 0 time-point. Autoradiographs were analyzed by scanning densitometry. Each data point is the mean ± SE of four independent experiments. *, P < 0.05.
F<sc>igure</sc> 7.
Figure 7.
Stability of ENaC in the apical plasma membrane of A6 cells. (A) Control and aldosterone-treated A6 cells were biotinylated on the apical membrane and chased for the times indicated (min). Western blots of recovered biotinylated apical subunits. (B) Time curse of the decay in surface subunits measured by scanning densitometry normalized to the 0 time-point. Each data point is the mean ± SE of 12 (α), 11 (β), or 10 (γ) independent experiments.
F<sc>igure</sc> 8.
Figure 8.
Chloroquine effects on the half-life of ENaC subunits in the plasma membrane. A6 cells were treated as in Fig. 7, except that 100 μM chloroquine was added to one group of cells during the chase time. Western blots are shown for each of the three ENaC subunits for the control and chloroquine treated cells.
F<sc>igure</sc> 9.
Figure 9.
Time-course analysis of aldosterone effects on the abundance of mRNA from ENaC subunits. (A) A6 cells were grown for 10 d on filters, switched to serum-free medium for 2 d, and pretreated with 100 nM aldosterone for the indicated periods of time (in hours). Total RNA was extracted and analyzed by Northern blot with specific probes for α, β, and γ xENaC subunits. Xenopus β-actin served as an internal standard for RNA loading. (B) Intensity values were obtained with a phosphorimager and were normalized to the control. Each data point in the graph represents the mean ± SE of four independent experiments. *, P < 0.05.
F<sc>igure</sc> 10.
Figure 10.
Effect of aldosterone on the electrical properties of A6 cells grown on permeable supports. (A) Time course of Isc (μA/cm-2) from control cells (circles) and 100 nM aldosterone-treated cells (squares). (B) VT (mV). (C) RT (kΩ/cm2). Measurements were done 10 d after seeding. Each data point represents the mean ± SD of 10 independent measurements. *, P < 0.05.
F<sc>igure</sc> 11.
Figure 11.
Representative examples of ENaC unitary currents from control and aldosterone-treated A6 cells. Traces show single-channel cell-attached patches from the apical membrane of A6 cells grown on permeable supports. The pipette solution contained 140 mM Na. Pipette voltage was 40 mV. Open and closed levels are indicated on the left. Bars in the right lower corner indicate current and time scales. Data were acquired at 2 kHz and filtered at 1 kHz for display.

Comment in

References

    1. Alvarez de la Rosa, D., P. Zhang, A. Naray-Fejes-Toth, G. Fejes-Toth, and C.M. Canessa. 1999. The serum and glucocorticoid kinase sgk increases the abundance of epithelial sodium channels in the plasma membrane of Xenopus oocytes. J. Biol. Chem. 274:37834–37839. - PubMed
    1. Alvarez de la Rosa, D., C.M. Canessa, G.K. Fyfe, and P. Zhang. 2000. Structure and regulation of amiloride-sensitive sodium channels. Annu. Rev. Physiol. 62:573–594. - PubMed
    1. Asher, C., H. Wald, B.C. Rossier, and H. Garty. 1996. Aldosterone-induced increase in the abundance of Na+ channel subunits. Am. J. Physiol. 271:C605–C611. - PubMed
    1. Berger, S., M. Bleich, W. Schmid, T.J. Cole, J. Peters, H. Watanabe, W. Kriz, R. Warth, R. Greger, and G. Schutz. 1998. Mineralocorticoid receptor knockout mice: pathophysiology of Na+ metabolism. Proc. Natl. Acad. Sci. USA. 95:9424–9429. - PMC - PubMed
    1. Bindels, R.J., J.A. Schafer, and M.C. Reif. 1988. Stimulation of sodium transport by aldosterone and arginine vasotocin in A6 cells. Biochim. Biophys. Acta. 972:320–330. - PubMed

Publication types

MeSH terms