. 2002 May;119(5):443-66.
doi: 10.1085/jgp.20028530.

Openings of the rat recombinant alpha 1 homomeric glycine receptor as a function of the number of agonist molecules bound

Affiliations

Openings of the rat recombinant alpha 1 homomeric glycine receptor as a function of the number of agonist molecules bound

Marco Beato et al. J Gen Physiol. 2002 May.

Abstract

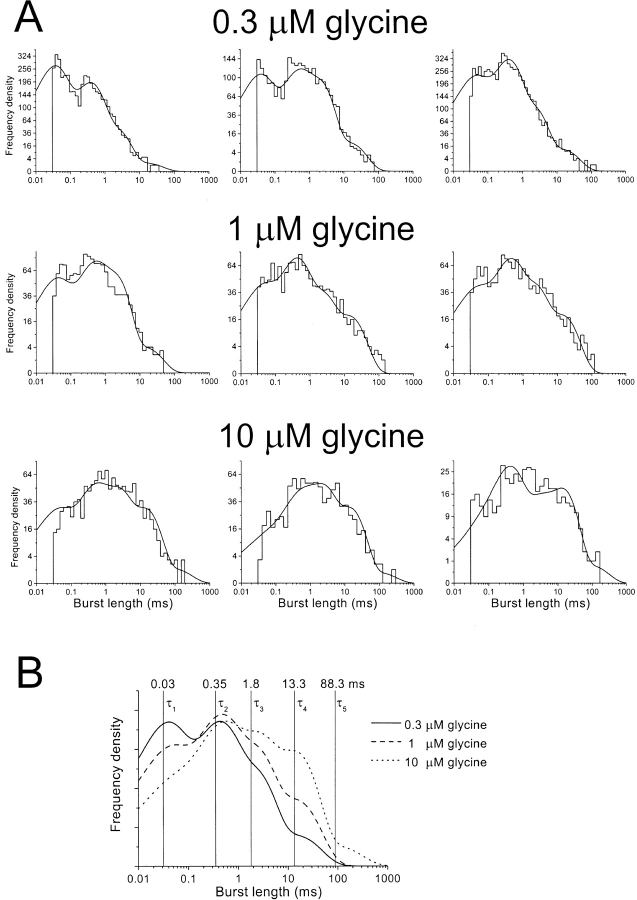
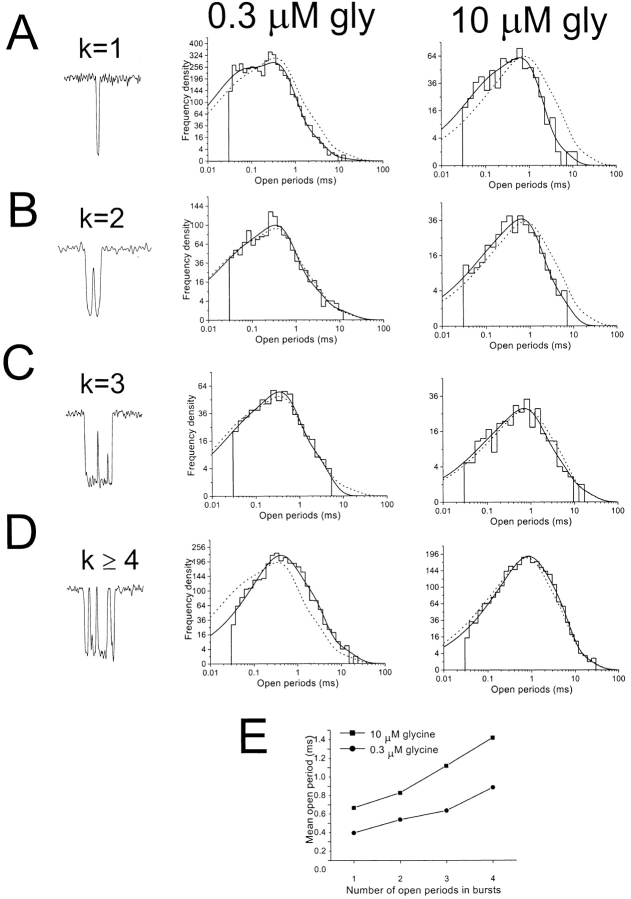
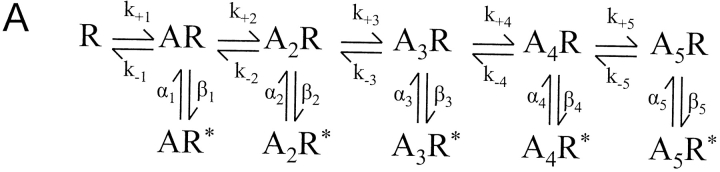
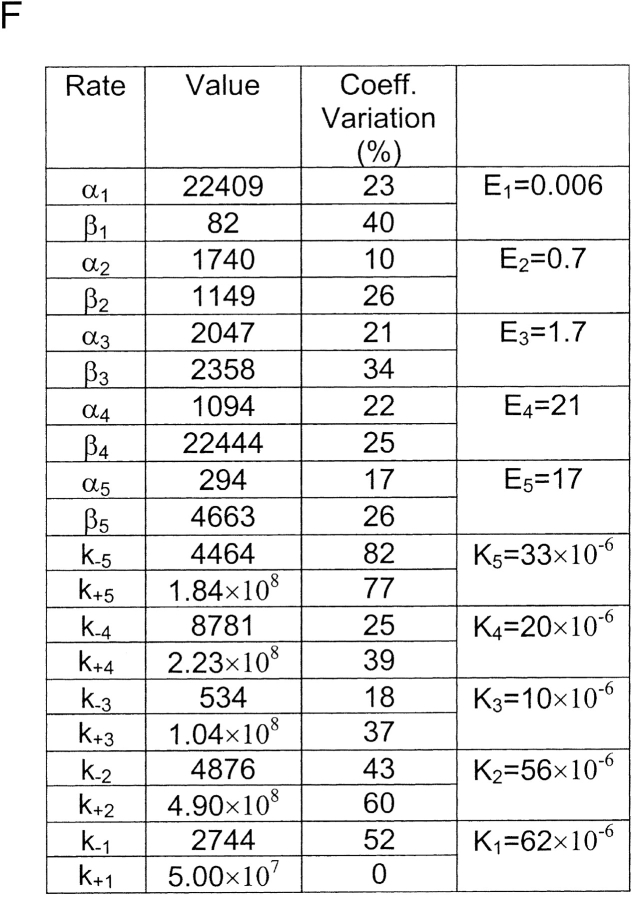
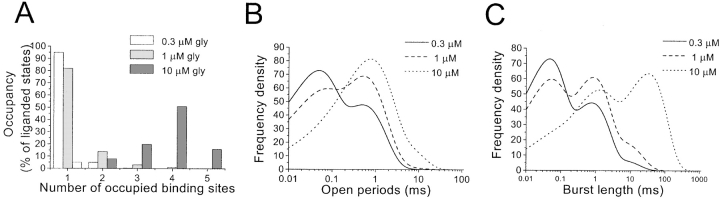
The functional properties of rat homomeric alpha 1 glycine receptors were investigated using whole-cell and outside-out recording from human embryonic kidney cells transfected with rat alpha1 subunit cDNA. Whole-cell dose-response curves gave EC(50) estimates between 30 and 120 microM and a Hill slope of approximately 3.3. Single channel recordings were obtained by steady-state application of glycine (0.3, 1, or 10 microM) to outside-out patches. Single channel conductances were mostly 60-90 pS, but smaller conductances of approximately 40 pS were also seen (10% of the events) with a relative frequency that did not depend on agonist concentration. The time constants of the apparent open time distributions did not vary with agonist concentration, but short events were more frequent at low glycine concentrations. There was also evidence of a previously missed short-lived open state that was more common at lower glycine concentrations. The time constants for the different components of the burst length distributions were found to have similar values at different concentrations. Nevertheless, the mean burst length increased with increasing glycine. This was because the relative area of each burst-length component was concentration dependent and short bursts were favored at lower glycine concentrations. Durations of adjacent open and shut times were found to be strongly (negatively) correlated. Additionally, long bursts were made up of longer than average openings separated by short gaps, whereas short bursts usually consisted of single isolated short openings. The most plausible explanation for these findings is that long bursts are generated when a higher proportion of the five potential agonist binding sites on the receptor is occupied by glycine. On the basis of the concentration dependence and the intraburst structure we provide a preliminary kinetic scheme for the activation of the homomeric glycine receptor, in which any number of glycine molecules from one to five can open the channel, although not with equal efficiency.


Figures

F<sc>igure</sc> 7.
Figure 7.
Simultaneous fits of burst length distributions from nine patches, with τ values constrained to be equal. A shows data from nine experiments (three for each concentration of glycine that was tested), fitted with the time constants constrained to be the same for all the experiments. The curves drawn in B were drawn using the fitted τ values and average area for each concentration. Vertical lines mark the values of the time constants for each exponential component.
F<sc>igure</sc> 1.
Figure 1.
Variability of EC 50 values for whole-cell responses elicited by glycine on HEK293 cells transfected with the rat α1 GlyR subunit. A shows current responses to the application of increasing concentrations of glycine recorded at −60 mV holding potential. Responses increase to a maximum value of ∼8 nA for concentrations greater than 200 μM. The full dose-response curve obtained in the experiment of A is plotted in B, where the continuous line is the fit of the Hill equation (here EC 50 = 64.2 μM, I max = 8.17 nA and Hill slope 3.25). C shows a scatter plot of the EC 50 values fitted from 13 cells versus the maximum current detected. Linear correlation between the two quantities does not appear to be strong (r = −0.4).
F<sc>igure</sc> 2.
Figure 2.
GlyR can open to different conductance levels independently of the applied glycine concentration. Downward deflections in the traces in A are examples of openings of GlyR channels elicited by 10 μM glycine in an outside-out patch at −100 mV. Three portions of the record are shown in the top row. Most of the openings occur at a conductance level of 86 pS, but some 40 pS openings were detected as well (top row, middle trace). Events are displayed in the bottom row of A at a faster time scale in order to show the fine structure of bursts of openings for small and large amplitudes. A histogram of the fitted amplitude distribution for the experiment above is shown in B. Data were fitted with two Gaussian curves with peaks at 4.0 pA (1.4 pA standard deviation) and 8.4 pA (1.2 pA standard deviation). The areas under each component were, respectively, 20 and 80%. The histogram in C shows that the average proportion of low (∼40 pS) and high (60–90 pS) openings (0.3, 1, and 10 μM, n = 14, 12, and 5, respectively) was not related to agonist concentration. On average, openings to the sublevel accounted for ∼10% of the fitted events.
F<sc>igure</sc> 3.
Figure 3.
The mean duration of apparent open periods increases with agonist concentration. Open period distributions in A were obtained from different patches in response to the application of 0.3, 1, and 10 μM glycine. Time constants were (relative area given in parentheses) τ1 = 0.04 ms (19%), τ2 = 0.31 ms (62%), τ3 = 1.1 ms (17%), and τ4 = 3.1 ms (2%) for 0.3 μM glycine; τ1 = 0.03 ms (18%), τ2 = 0.4 ms (28%), τ3 = 0.8 ms (37%), and τ4 = 2.1 ms (17%) for 1 μM glycine; and τ1 = 0.03 ms (11%), τ2 = 0.4 ms (31%), τ3 = 1.1 ms (40%), and τ4 = 2.6 ms (18%) for 10 μM glycine. The mean open period for all the experiments (n = 14 for 0.3 μM, n = 12 for 1 μM, and n = 5 for 10 μM) is shown in B as a function of concentration (data pooled from all the experiments). C shows that the time constants for the four components vary little with glycine concentration (bottom plot), whereas (top histograms) the areas are strongly concentration dependent. The overall average effect of agonist concentration on open times is shown in D by plotting the multiexponential curves obtained from averaging the τ values and the areas observed for each concentration. The three different curves (each scaled to contain the same number of events) show an excess of short open times for low glycine concentrations.
F<sc>igure</sc> 4.
Figure 4.
Shut times distributions at different glycine concentrations. The shut time distributions were fitted with four exponential components. (A and B) Differences in channel density affect shut time distributions at the lowest agonist concentration. Channel density is low in A, where a good separation is achieved between long and short shut times, but the fit is inaccurate because relatively few observations can be obtained in the life of the patch (see the scale for the number of events on the ordinates). B shows a fit from another experiment, with the same concentration, but with a much higher density of channels in the patch. In this case there are many events (sufficient for burst analysis), but the separation between long and short shut times is less evident. Typical examples from experiments at 1 or 10 μM glycine are shown in C and D, respectively. In both of these cases a good definition of short and long shut times was achieved.
F<sc>igure</sc> 5.
Figure 5.
Changes in burst structure with agonist concentration. A and B show examples of bursts with 0.3 or 10 μM glycine, respectively. The portions of the trace corresponding to the bar are expanded on a faster time scale in the bottom rows of each panel. While bursts in A are short and often consist of a single opening, bursts at higher concentration of glycine (B) are longer and made up of several openings and shuttings. C shows the increase in the mean number of open periods as a function of concentration. The plot in D shows that the mean burst length increases with increasing concentration of agonist.
F<sc>igure</sc> 6.
Figure 6.
The distribution of burst lengths and its concentration dependence. A shows burst lengths distributions from three different patches, one for each of the concentrations tested. The effect of agonist concentration on the average of the fitted parameters for the different components is shown in B. Note (bottom plot) that the average of the five fitted time constants did not change significantly with concentration, whereas the areas of each component (top plot, B) were strongly concentration dependent. The three curves in C were drawn using the average of each parameter (τ values and areas) for each concentration. The three curves show that long bursts are more frequent at high glycine concentrations, whereas short bursts are dominant at lower concentrations.
F<sc>igure</sc> 8.
Figure 8.
Correlation of apparent open periods and shut times. (A) Conditional distributions of open times adjacent to short (left histogram) or long (right histogram) shut states during steady-state application of 0.3 μM glycine. The continuous line is the fit to the data shown in the histogram and the dashed lines in each plot show the corresponding fit of the histogram of the opposite column (scaled to contain the same number of observation as the experimental data). The same conditional distributions for an experiment with 10 μM glycine are shown in B. The difference between continuous and dashed lines show the excess of short (long) openings occurring adjacent to long (short) shut states for both concentrations. (C) Pooled data from experiments with 0.3 μM (n = 14), 1 μM (n = 12), and 10 μM (n = 5) glycine. The plot shows the relationship between the mean duration of adjacent open and shut intervals. The conditional mean open period is expressed in percentage of the overall mean open period for each experiment and such percentages were averaged for each shut time interval (chosen to correspond with the components of the shut time distribution). For the three concentrations tested, the mean apparent open period decreased with increasing range of shut times.
F<sc>igure</sc> 9.
Figure 9.
The structure of bursts: bursts with one opening contain openings shorter than average. Open period distributions were restricted to include only open periods occurring in bursts containing k openings. Open periods occurring in bursts with k = 1, 2, 3, or ≥4 openings are shown in A–D for two patches exposed to 0.3 and 10 μM glycine. The corresponding fits for the distribution of all the open times (dashed lines) are superimposed to the fit of the open times in bursts with k openings. The difference between the two curves in each plot shows that longer open periods occur more frequently in bursts with a greater number of openings. This is shown also in the plot of E, in which the mean open period increases as a function of the number of opening in the bursts (data refers to the same two patches as in A–D).
F<sc>igure</sc> 10.
Figure 10.
Open periods in bursts with k openings. A and B show the results from n = 4 and n = 3 experiments with 0.3 and 10 μM glycine, respectively. The four curves are obtained by averaging the parameters for the open time distributions for open periods taken from bursts with k openings. For both concentrations, comparison of the curves shows that bursts with 1 or 2 openings contain much shorter open periods than bursts with 3 or ≥4 openings. This is also reflected in the mean open period as a function of the number of openings per burst, plotted in C. In this plot the mean open period is expressed as percentage of the overall mean open period for each experiment.
F<sc>igure</sc> 11.
Figure 11.
Results of the direct fit of a plausible mechanism to the sequence of events. A shows the mechanism fitted. B and C show open and shut time distributions of an experiment at 10 μM glycine. The solid line superimposed on the histogram is the HJC open period distribution calculated from the fitted rate constants, taking into account the experimental time resolution (30 μs), whereas the dashed line is the distribution expected if there were no missed events. Note that the shut time distribution is fitted only up to t crit (3 ms in this case). D and E show open times conditional distributions for the same patch, namely open periods adjacent to shut states shorter (D) or longer than 3 ms (E; compare Fig. 8). F shows the averages of the rate constants obtained by fitting the scheme in A to the data of nine patches (three patches at each of the concentrations tested of 0.3, 1, and 10 μM). The other columns show the coefficient of variation of the fitted parameters and, for reference, the corresponding dissociation constant (K, expressed in M) and efficacy (E = β/α) for each of the states of ligation. Rate constants are expressed in s−1 or M−1 s−1 as appropriate.
F<sc>igure</sc> 12.
Figure 12.
The predictions of the fitted model agree with the observed concentration dependence. A shows the equilibrium occupancy (normalized for visibility) of each state of ligation at the different concentrations tested. For singly liganded molecules, for example, the occupancy of AR + AR* are divided by 1 − p R, where by p R is the occupancy of the resting state, R. B shows the concentration dependence of open times as predicted by the fit (c.f. observed distribution in Fig. 3 D). C shows the predicted burst length distributions at the glycine concentrations tested and should be compared with Fig. 6 C. All calculations are based on the average rate constants as in Fig. 11 F.

References

    1. Akagi, H., K. Hirai, and F. Hishinuma. 1991. Functional properties of strychnine-sensitive glycine receptors expressed in Xenopus oocytes injected with a single mRNA. Neurosci. Res. 11:28–40. - PubMed
    1. Blatz, A.L., and K.L. Magleby. 1986. Quantitative description of three modes of activity of fast chloride channels from rat skeletal muscle. J. Physiol. 378:141–174. - PMC - PubMed
    1. Blatz, A.L., and K.L. Magleby. 1989. Adjacent interval analysis distinguishes among gating mechanisms for the fast chloride channel from rat skeletal muscle. J. Physiol. 410:561–585. - PMC - PubMed
    1. Bormann, J., O.P. Hamill, and B. Sakmann. 1987. Mechanism of anion permeation through channels gated by glycine and γ-aminobutyric acid in mouse cultured spinal neurones. J. Physiol. 385:243–286. - PMC - PubMed
    1. Bormann, J., N. Rundström, H. Betz, and D. Langosch. 1993. Residues within transmembrane segment M2 determine chloride conductance of glycine receptor homo- and hetero-oligomers. EMBO J. 12:3729–3737. - PMC - PubMed

Publication types

Associated data