. 2002 Apr 30;99(9):5890-5.
doi: 10.1073/pnas.092632599.

The identification of functional modules from the genomic association of genes

Affiliations

The identification of functional modules from the genomic association of genes

Berend Snel et al. Proc Natl Acad Sci U S A. .

Abstract

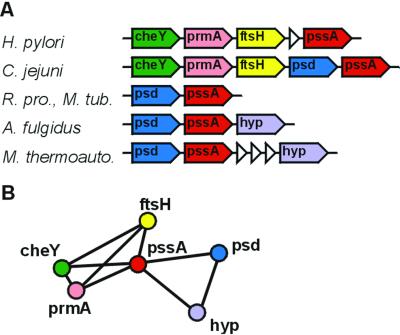
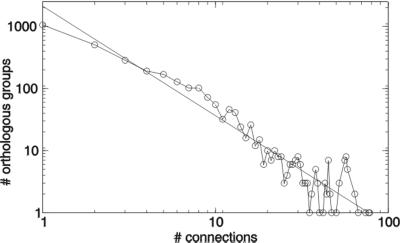
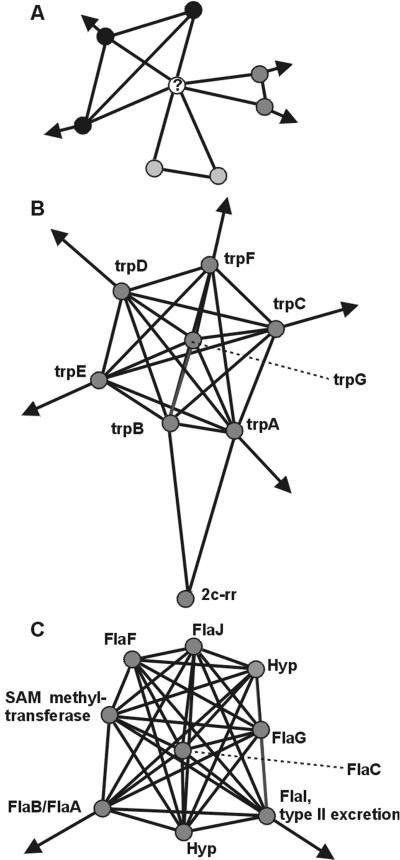
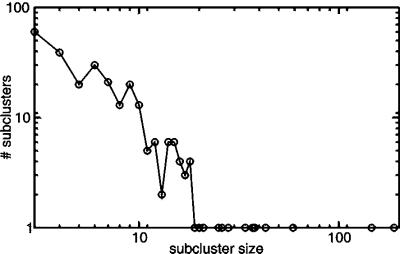
By combining the pairwise interactions between proteins, as predicted by the conserved co-occurrence of their genes in operons, we obtain protein interaction networks. Here we study the properties of such networks to identify functional modules: sets of proteins that together are involved in a biological process. The complete network contains 3,033 orthologous groups of proteins in 38 genomes. It consists of one giant component, containing 1,611 orthologous groups, and of 516 small disjointed clusters that, on average, contain only 2.7 orthologous groups. These small clusters have a homogeneous functional composition and thus represent functional modules in themselves. Analysis of the giant component reveals that it is a scale-free, small-world network with a high degree of local clustering (C = 0.6). It consists of locally highly connected subclusters that are connected to each other by linker proteins. The linker proteins tend to have multiple functions, or are involved in multiple processes and have an above average probability of being essential. By splitting up the giant component at these linker proteins, we identify 265 subclusters that tend to have a homogeneous functional composition. The rare functional inhomogeneities in our subclusters reflect the mixing of different types of (molecular) functions in a single cellular process, exemplified by subclusters containing both metabolic enzymes as well as the transcription factors that regulate them. Comparative genome analysis, thus, allows identification of a level of functional interaction between that of pairwise interactions, and of the complete genome.


Figures

Figure 1
Figure 1
Going from conserved gene order to networks of genomic association. (A) The conserved gene order of six orthologous groups in six species. Genes with same color and name belong to the same orthologous group. The small empty triangles denote genes that do not have conserved gene order. The correspondence of the full species names to the ones used in the figure is as follows: H. pylori, Helicobacter pylori 2669; C. jejuni, Campylobacter jejuni NCTC11168; R. pro., Rickettsia prowazekii; M. tub., Mycobacterium tuberculosis Rv; A. fulgidus, Archaeoglobus fulgidus; M. thermoauto., Methanobacterium thermoautotrophicum. (B) The corresponding network. We consider two orthologous groups to have a connection if they co-occur in the same potential operon two or more times.
Figure 2
Figure 2
Distribution of the number of associations per orthologous group. The drawn line is a power law fit to the data.
Figure 3
Figure 3
Parts of the network. Each filled circle is an orthologous group of genes, each thick line is a significant association. The dotted line is used to connect a circle to its gene name. The arrows in A mean that these orthologous groups have connections outside the focus of the panel, while the arrows in B and C denote that an orthologous group has an association to another orthologous group that is not part of the subcluster as delineated by our method. (A) Schematic example of the local network topology around a linker. The orthologous group with the “?” is the linker. The three other sets of circles of the same color are the mutually exclusive associated sets of orthologous groups. (B) The tryptophan subcluster as retrieved by our approach. The node labeled “2c-rr” is a predicted two-component response regulator. (C) Archaeal flagellum subcluster. We predict the two orthologous groups without clear predicted function to also have a role in the archaeal flagellum. The genes in the hypothetical orthologous group are: PF_353433, PAB1376, PH0544, and MJ0905. The genes in the S-adenosylmethionine (SAM)-dependent methyltransferase orthologous group are PF_352470, PAB1377, PH0545, and MJ0906.
Figure 4
Figure 4
Occurrence distribution of the number of subcluster sizes derived from the giant component. Most subclusters are of size 3. The biggest subclusters seem to be outliers and, thus, might indicate a failure of our method to correctly split them.
Figure 5
Figure 5
Venn diagrams of linkers in multiple subclusters. Each small ellipse is an orthologous group. The big ellipses circumscribe the subclusters as our approach delineates them. Orthologous groups are named by a gene name of a prominent member. A shows the two subclusters of which the hypF/ureG orthologous group is a member. This orthologous group is named uGhB in this figure. B shows the two subclusters, of which the integral membrane protein transport orthologous group (hofB) is a member. Note that one of the two subclusters is the archaeal flagellum subcluster from Fig. 3C.

References

    1. Dandekar T, Snel B, Huynen M, Bork P. Trends Biochem Sci. 1998;23:324–328. - PubMed
    1. Overbeek R, Fonstein M, D'Souza M, Pusch G D, Maltsev N. In Silico Biol. 1998;1:0009. http://www.bioinfo.de/isb/1998/01/0009 , http://www.bioinfo.de/isb/1998/01/0009. . - PubMed
    1. Enright A J, Iliopoulos I, Kyrpides N C, Ouzounis C A. Nature (London) 1999;402:86–90. - PubMed
    1. Marcotte E M, Pellegrini M, Ng H L, Rice D W, Yeates T O, Eisenberg D. Science. 1999;285:751–753. - PubMed
    1. Pellegrini M, Marcotte E M, Thompson M J, Eisenberg D, Yeates T O. Proc Natl Acad Sci USA. 1999;96:4285–4288. - PMC - PubMed

LinkOut - more resources