. 2002 Apr 8:2:7.
doi: 10.1186/1471-2148-2-7.

The evolutionary position of nematodes

Affiliations

The evolutionary position of nematodes

Jaime E Blair et al. BMC Evol Biol. .

Abstract

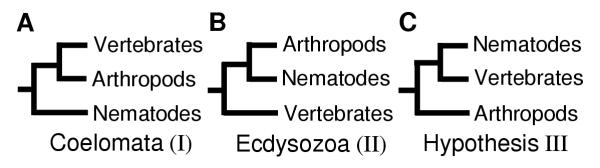
Background: The complete genomes of three animals have been sequenced by global research efforts: a nematode worm (Caenorhabditis elegans), an insect (Drosophila melanogaster), and a vertebrate (Homo sapiens). Remarkably, their relationships have yet to be clarified. The confusion concerns the enigmatic position of nematodes. Traditionally, nematodes have occupied a basal position, in part because they lack a true body cavity. However, the leading hypothesis now joins nematodes with arthropods in a molting clade, Ecdysozoa, based on data from several genes.

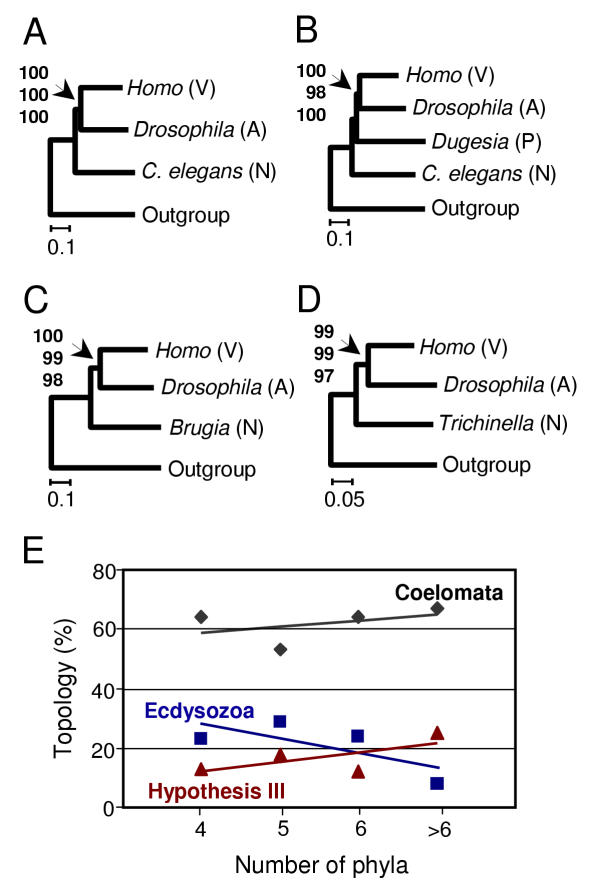
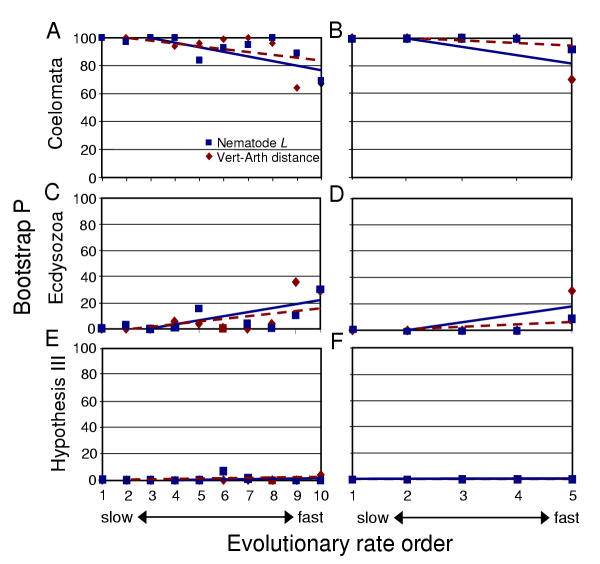
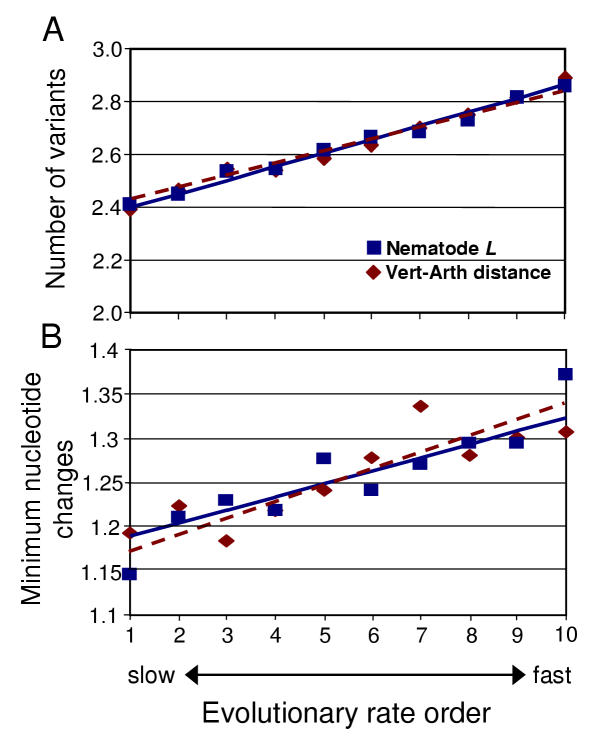
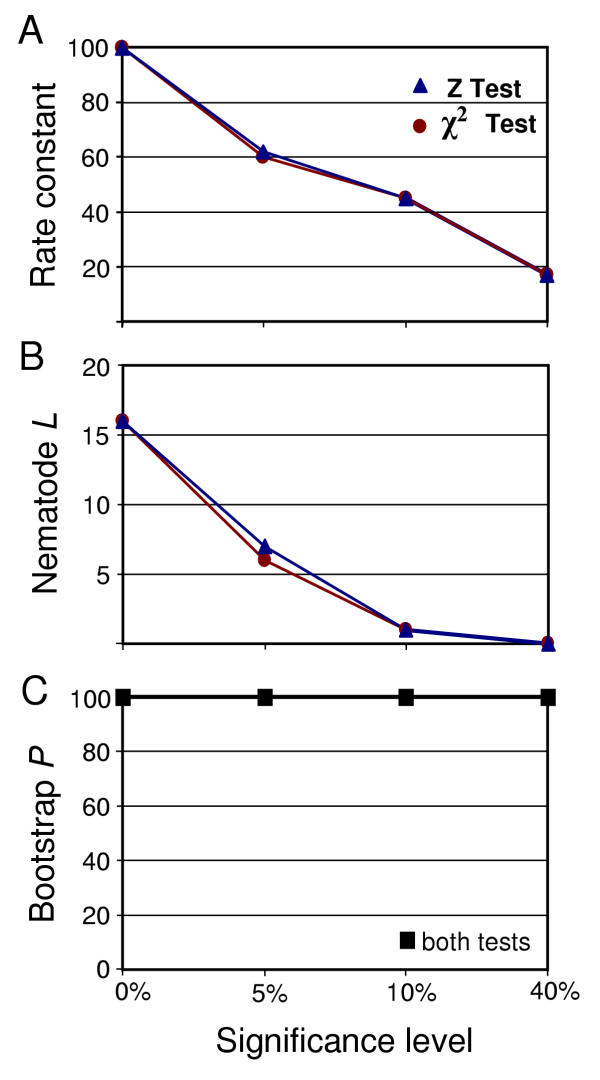
Results: We tested the Ecdysozoa hypothesis with analyses of more than 100 nuclear protein alignments, under conditions that would expose biases, and found that it was not supported. Instead, we found significant support for the traditional hypothesis, Coelomata. Our result is robust to different rates of sequence change among genes and lineages, different numbers of taxa, and different species of nematodes.

Conclusion: We conclude that insects (arthropods) are genetically and evolutionarily closer to humans than to nematode worms.


Figures

Figure 1
Figure 1
The three possible relationships of vertebrates, arthropods, and nematodes.
Figure 2
Figure 2
Phylogenetic analyses of individual and combined (concatenated) sequence alignments bearing on the position of nematodes. V = vertebrate, A = arthropod, N = nematode, P = platyhelminth. Bootstrap values (>95%) are shown for neighbor-joining, maximum parsimony, and maximum likelihood, respectively; all are indicated for the node joining Homo and Drosophila (=Coelomata). Posterior probabilities are not shown (all highlighted nodes = 1.0). (A) Four-taxon analysis of 100 combined protein alignments (44,214 amino acids), using nematode Caenorhabditis elegans (Chromadorea, Rhabditida, Rhabditoidea, Rhabditidae); the nematode branch is approximately 16% longer than the vertebrate and arthropod branches. (B) Five-taxon analysis of 100 combined proteins includes planarian EST sequences (14,041 amino acids); the nematode branch is approximately 23% longer. Other trees show different representative nematodes. (C) Brugia (Chromadorea, Spirurida, Filarioidea, Onchocercidae), based on 18 combined proteins (4598 amino acids); nematode branch= 15% longer. (D) Trichinella (Enoplea, Trichocephalida, Trichinellidae), based on 6 combined proteins (2261 amino acids); nematode branch = 24% longer than the vertebrate branch and 5% shorter than the arthropod branch. (E) Proportion of individual protein analyses supporting each of the three possible topologies with differing numbers of phyla included (4 taxa = 124 proteins, 5 taxa= 107 proteins, 6 taxa= 66 proteins, >6 taxa = 12 proteins).
Figure 3
Figure 3
Effect of genetic distance on bootstrap support for the three hypotheses from analysis of 100 nuclear proteins with four taxa. (A, B) show bootstrap support for Coelomata; (C, D) for Ecdysozoa; (E, F) for Hypothesis III. Proteins were ordered from slowest evolving to fastest evolving based on two criteria: vertebrate-arthropod pairwise distance (diamonds) and nematode branch length (squares). Proteins were concatenated into ten groups often (A, C, E) and five groups of twenty (B, D, F). Graphs show rate from slowest to fastest evolving (left to right). Trend lines are indicated (solid for vertebrate-arthropod distance, dashed for nematode branch length).
Figure 4
Figure 4
Test of mutational saturation in the four-taxon data set. (A) The mean number of variants per variable site was averaged for ten groups often according to evolutionary rate (vertebrate-arthropod distance = diamonds, nematode branch length = squares). (B) The minimum number of nucleotide changes required for unique nematode variants were also averaged according to evolutionary rate. Trend lines are indicated (solid for vertebrate-arthropod distance, dashed for nematode branch length).
Figure 5
Figure 5
Effect of rate constancy on bootstrap support for Coelomata in four-taxon analysis. Graphs show results before application of tests (left, 0-level) followed by increasing stringency (5, 10, 40% significance) of the chi-square test [22] (circles) and Z-test [23] (triangles); the 5% level is normally used. (A) number of proteins passing rate constancy at each cutoff level. (B) relative nematode branch length upon concatenation of all rate constant proteins at each level. (C) bootstrap support for Coelomata for each rate-constant concatenation.

References

    1. Hyman LH. The Invertebrates. New York: McGraw-Hill; 1940.
    1. Jenner RA. Evolution of animal body plans: the role of metazoan phylogeny at the interface between pattern and process. Evol Dev. 2000;2:208–221. doi: 10.1046/j.1525-142X.2000.00060.x. - DOI - PubMed
    1. Aguinaldo AM, Turbeville JM, Linford LS, Rivera MC, Garey JR, Raff RA, Lake JA. Evidence for a clade of nematodes, arthropods and other moulting animals. Nature. 1997;387:489–93. doi: 10.1038/387489a0. - DOI - PubMed
    1. Adoutte A, Balavoine G, Lartillot N, Lespinet O, Prud'homme B, de Rosa R. The new animal phylogeny: reliability and implications. Proc Natl Acad Sci USA. 2000;97:4453–6. doi: 10.1073/pnas.97.9.4453. - DOI - PMC - PubMed
    1. Carroll SB, Grenier JK, Weatherbee SD. In: From DNA to Diversity. Malden MA, editor. Blackwell Science; 2001.

Publication types

Substances