

Immunoglobulin heavy chain gene analysis in lymphomas: a multi-center study demonstrating the heterogeneity of performance of polymerase chain reaction assays
- PMID: 11986398
- PMCID: PMC1906994
- DOI: 10.1016/S1525-1578(10)60685-X
Immunoglobulin heavy chain gene analysis in lymphomas: a multi-center study demonstrating the heterogeneity of performance of polymerase chain reaction assays
Abstract
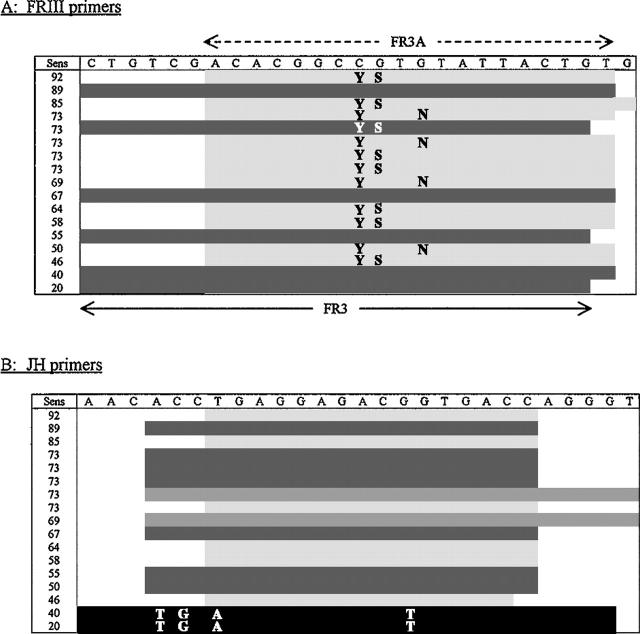
Determination of monoclonality through an evaluation of immunoglobulin heavy chain (IgH) gene rearrangements is a commonly performed and useful diagnostic assay. Many laboratories that perform this assay do so by the polymerase chain reaction (PCR). To evaluate current methods for performing IgH gene testing, 19 different Association of Molecular Pathology (AMP) member laboratories analyzed 29 blinded B cell and T cell lymphoid neoplasm samples of extracted DNA and formalin-fixed, paraffin-embedded (FFPE) tissue and were asked to complete a technical questionnaire. From this study, it is clear that Southern blot analysis remains the diagnostic gold standard, with a 100% diagnostic sensitivity and specificity. There was, however, remarkable heterogeneity in the performance of, and results obtained from, IgH PCR assays with diagnostic sensitivity ranging from over 90% to as low as 20%, when evaluating the same specimens. Many laboratories overestimate the diagnostic sensitivity of their IgH PCR assay, and there was a significant, and under appreciated, drop-off (from 61.3% to 41.8%) in detection in paired FFPE as compared with fresh/frozen tissues. Fixation has a dramatic impact on the inability to perform the test on FFPE (43.1%) versus DNA already extracted from fresh or frozen tissue (2.8%). A number of variables that affected the outcome of IgH PCR were identified. Strategies that improved the detection of monoclonal IgH rearrangements include: the addition of FRII to the FRIII upstream primer (increasing detection from 57.3% to 73.6%) and the use of the FR3A rather than the FR3 FRIII primer (increasing detection from 54.7% to 69.7%). Although numerous variables (from DNA extraction to PCR product detection) were evaluated, making it difficult to mandate alterations in laboratory practice, these findings ought to prompt diagnostic molecular pathology laboratories to reevaluate their claims of sensitivity, as well as their methodologies. Both pathologists and surgeons need to ensure that not all submitted material is fixed, if there is adequate sample. Importantly, there is a need for greater standardization to reduce the unacceptably high false negative rate of this crucial diagnostic assay.
Figures


References
-
- Jaffe ES, Harris NL, Stein H, Vardiman JW: WHO Classification of Tumours: Pathology and Genetics of Tumours of Haematopoietic and Lymphoid Tissues. 2001. France, IARC Press, Lyon
-
- Bagg A, Kallakury BV: Molecular pathology of leukemia and lymphoma. Am J Clin Pathol 1999, 112:S76-S92 - PubMed
-
- Bagg A: Minimal residual disease: how low do we go? Mol Diagn 2001, 6:1-7 - PubMed
-
- van Dongen JJM, Wolvers-Tettero ILM: Analysis of immunoglobulin and T cell receptor genes. Part II: possibilities and limitations in the diagnosis and management of lymphoproliferative diseases and related disorders. Clin Chim Acta 1991, 198:93-174 - PubMed
-
- Waldmann TA: The arrangement of immunoglobulin and T cell receptor genes in human lymphoproliferative disorders. Adv Immunol 1987, 40:247-321 - PubMed
Publication types
MeSH terms
Substances
LinkOut - more resources
Full Text Sources
Other Literature Sources
