. 2002 May 6;195(9):1129-43.
doi: 10.1084/jem.20011956.

The transcription factor T-bet regulates mucosal T cell activation in experimental colitis and Crohn's disease

Affiliations

The transcription factor T-bet regulates mucosal T cell activation in experimental colitis and Crohn's disease

M F Neurath et al. J Exp Med. .

Erratum in

  • J Exp Med 2002 Jun 3;195(11):1513

Abstract

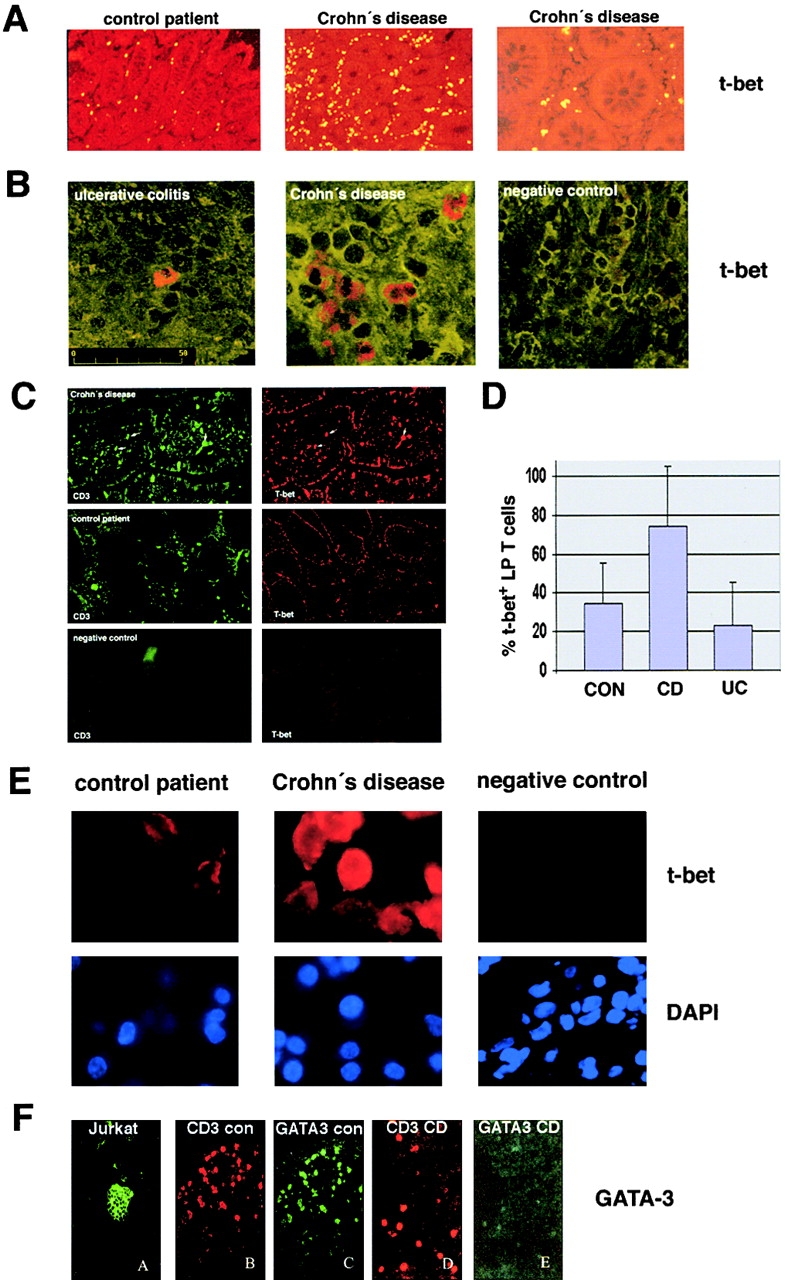
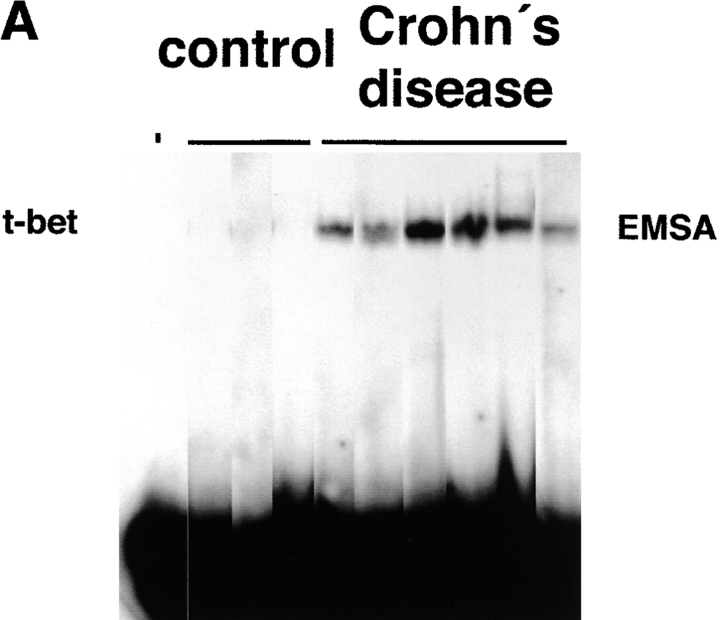
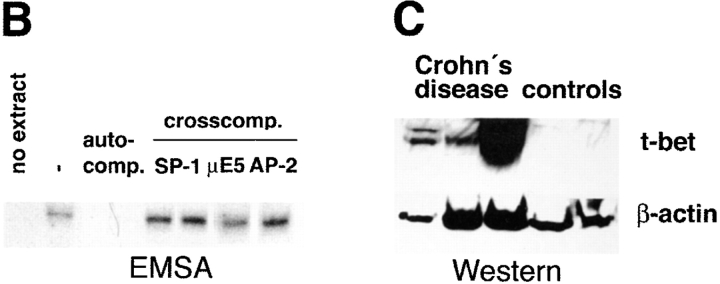
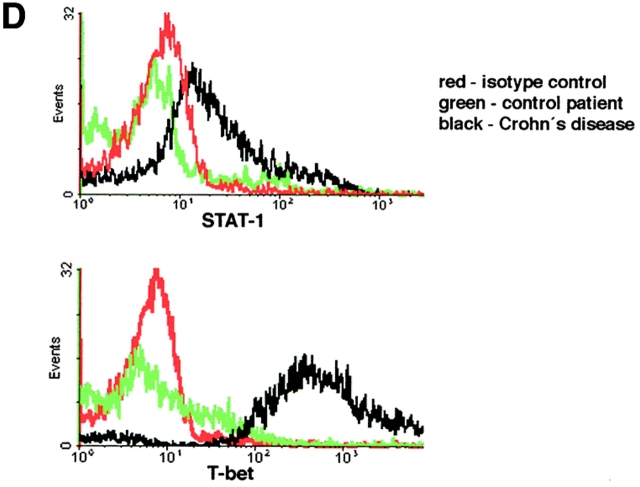
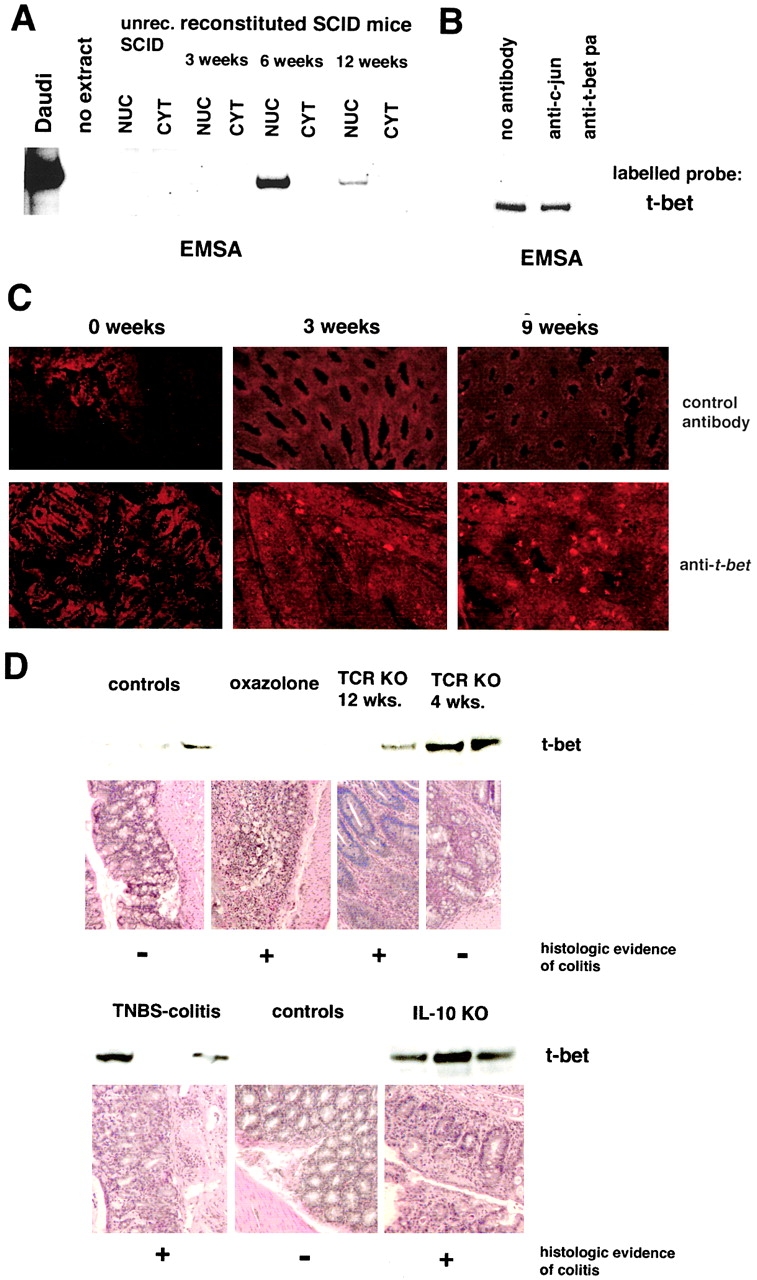
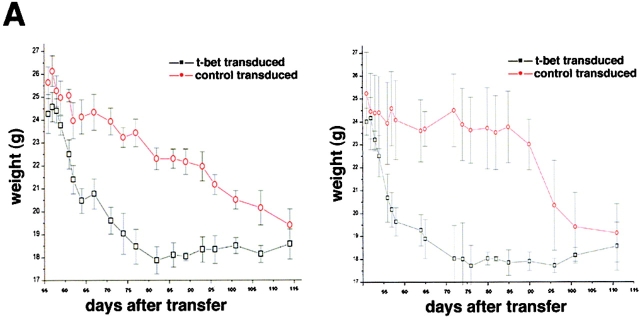
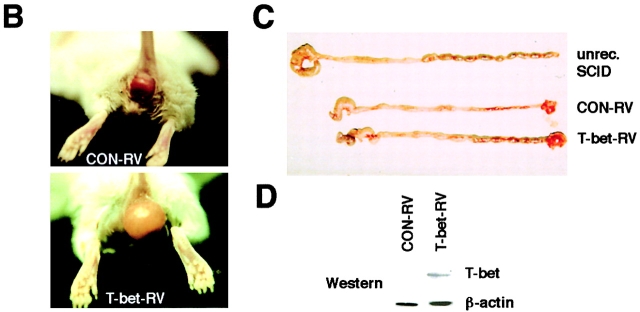
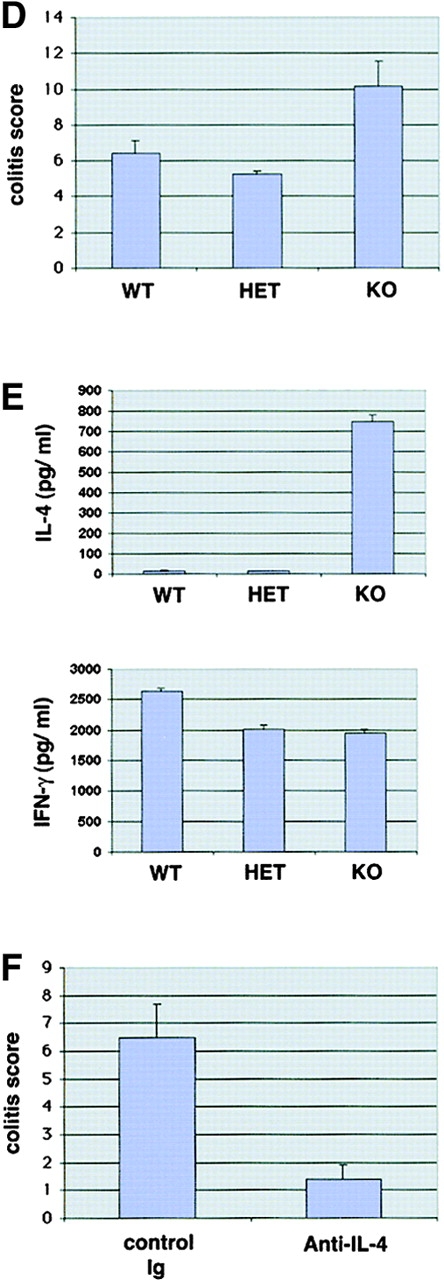
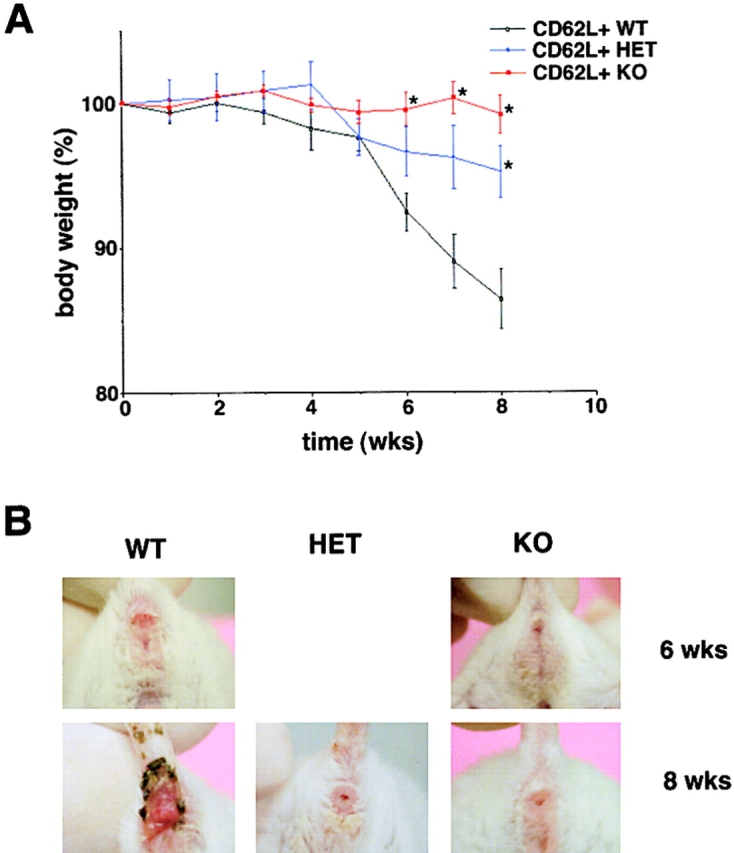
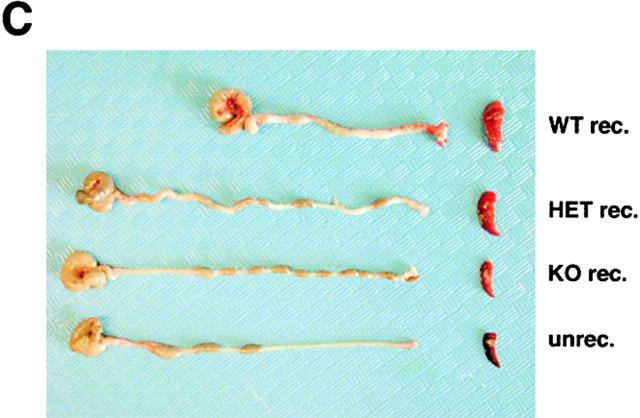
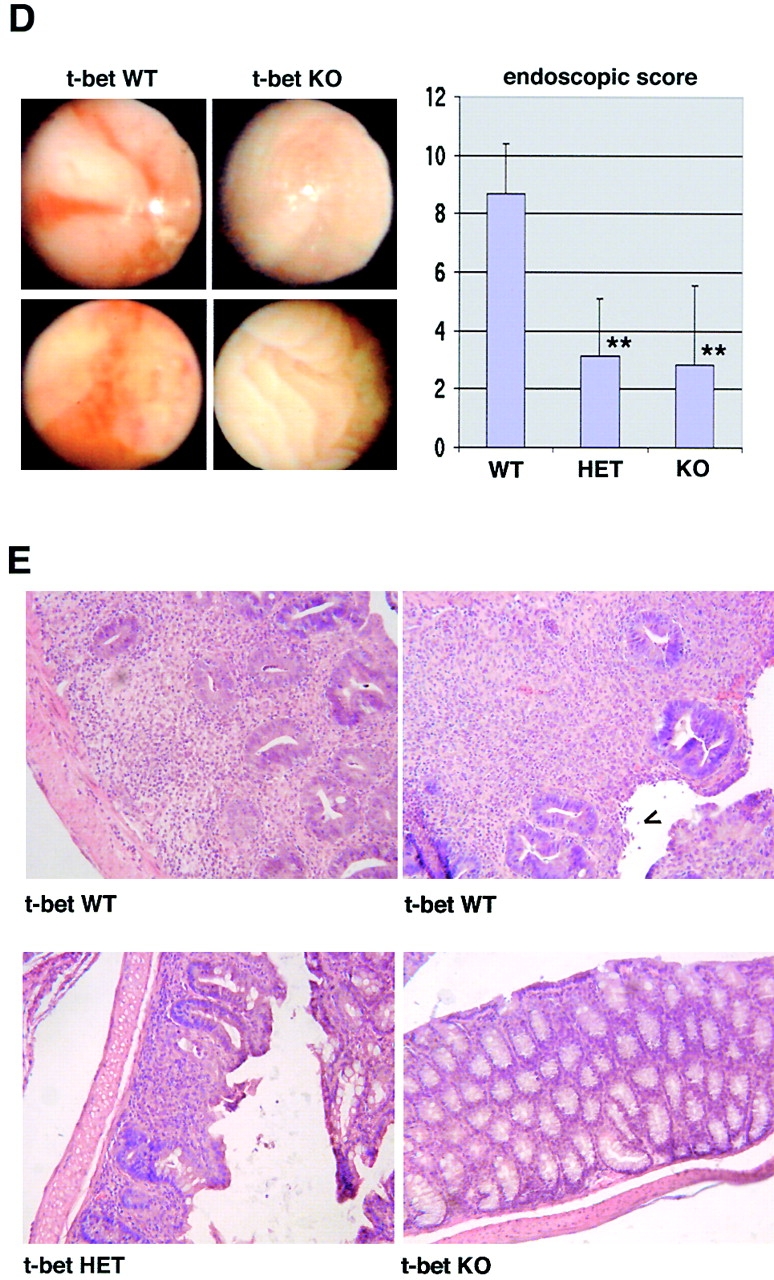
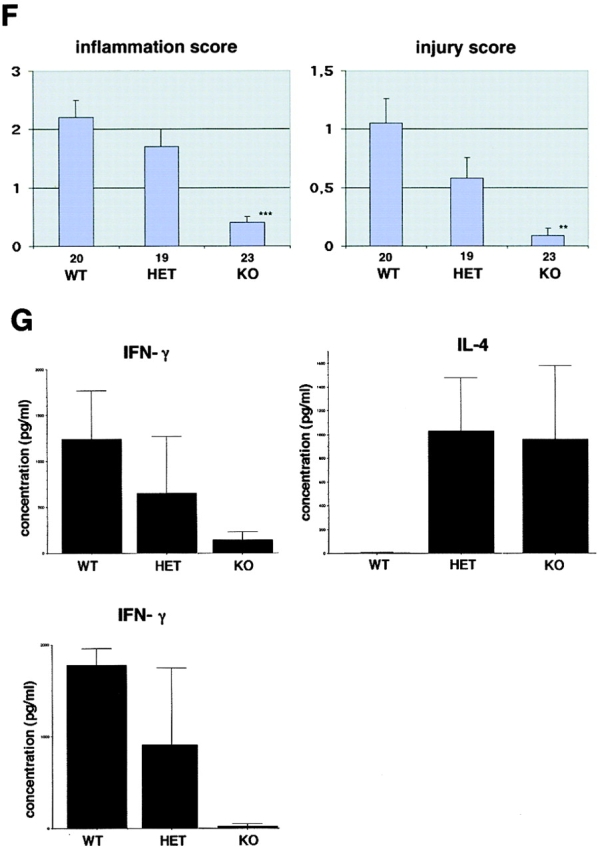
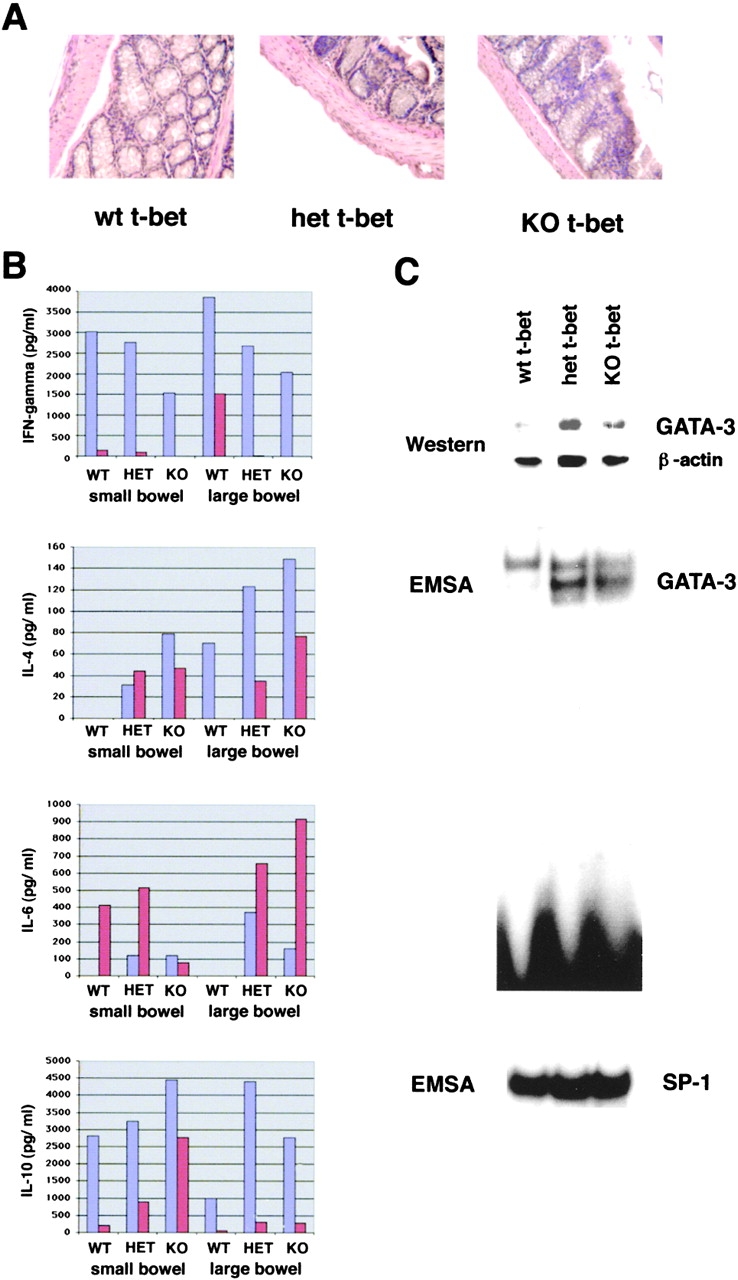
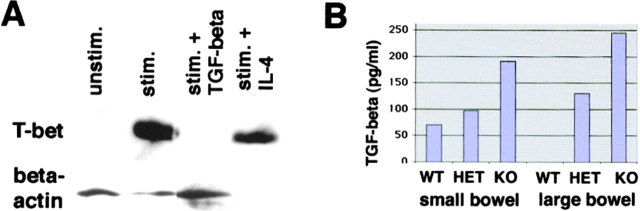
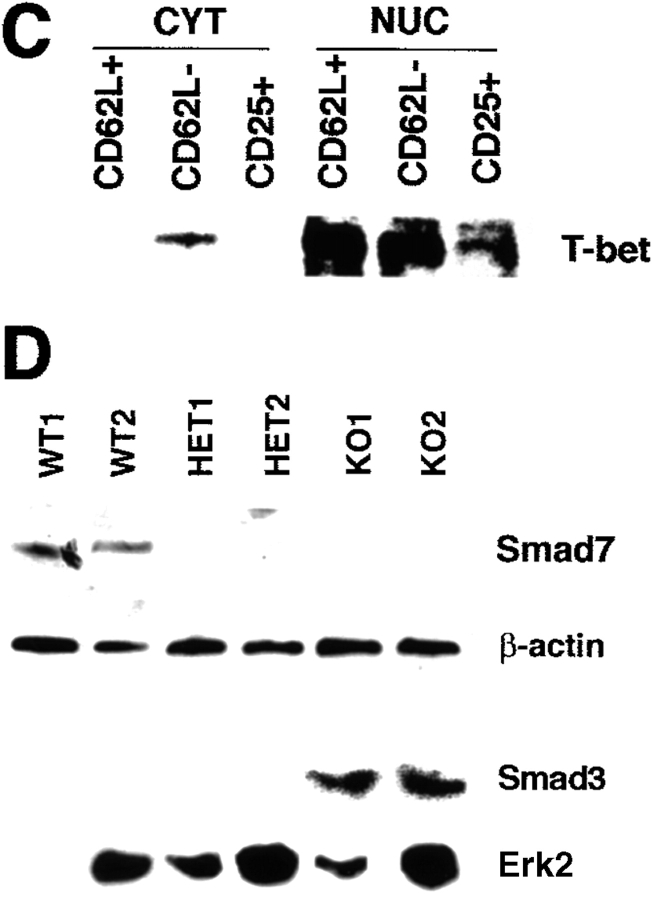
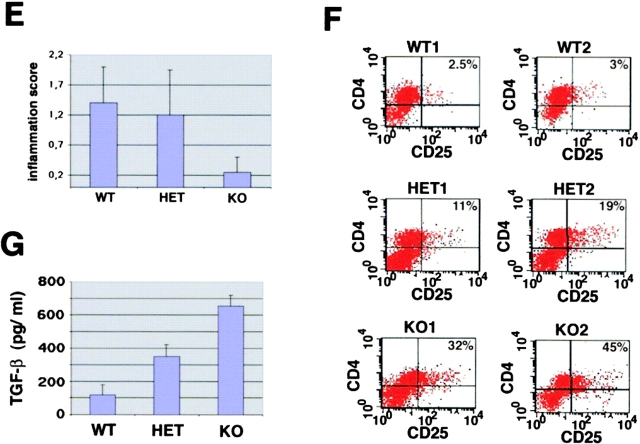
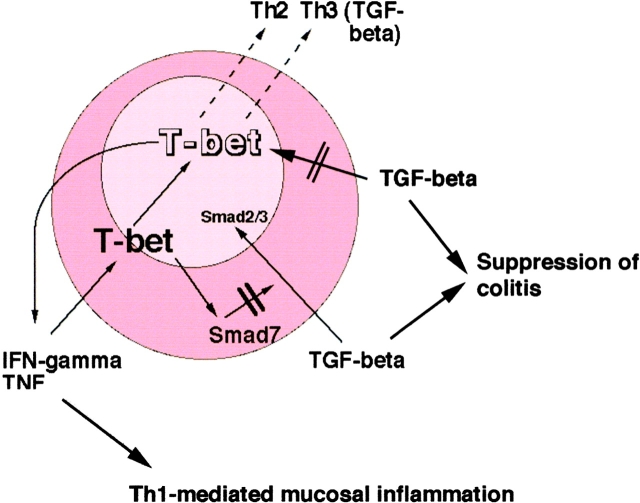
The balance between pro and antiinflammatory cytokines secreted by T cells regulates both the initiation and perpetuation of inflammatory bowel diseases (IBD). In particular, the balance between interferon (IFN)-gamma/interleukin (IL)-4 and transforming growth factor (TGF)-beta activity controls chronic intestinal inflammation. However, the molecular pathways that evoke these responses are not well understood. Here, we describe a critical role for the transcription factor T-bet in controlling the mucosal cytokine balance and clinical disease. We studied the expression and function of T-bet in patients with IBD and in mucosal T cells in various T helper (Th)1- and Th2-mediated animal models of chronic intestinal inflammation by taking advantage of mice that lack T-bet and retroviral transduction techniques, respectively. Whereas retroviral transduction of T-bet in CD62L(+) CD4(+) T cells exacerbated colitis in reconstituted SCID mice, T-bet-deficient T cells failed to induce colitis in adoptive transfer experiments suggesting that overexpression of T-bet is essential and sufficient to promote Th1-mediated colitis in vivo. Furthermore, T-bet-deficient CD62L(-) CD4(+) T cells showed enhanced protective functions in Th1-mediated colitis and exhibited increased TGF-beta signaling suggesting that a T-bet driven pathway of T cell activation controls the intestinal balance between IFN-gamma/IL-4 and TGF-beta responses and the development of chronic intestinal inflammation in T cell-mediated colitis. Furthermore, TGF-beta was found to suppress T-bet expression suggesting a reciprocal relationship between TGF-beta and T-bet in mucosal T cells. In summary, our data suggest a key regulatory role of T-bet in the pathogenesis of T cell-mediated colitis. Specific targeting of this pathway may be a promising novel approach for the treatment of patients with Crohn's disease and other autoimmune diseases mediated by Th1 T lymphocytes.


Figures

Figure 1.
Figure 1.
Accumulation of T-bet–expressing T lymphocytes in the LP of patients with Crohn's disease. (A and B) Analysis of T-bet expression in the LP from patients with IBD and control patients. Colon cryosections were stained with a T-bet antibody and sections were analyzed by immunofluorescense microscopy and confocal laser microscopy, respectively. Many T-bet positive cells were seen in patients with Crohn's disease but not ulcerative colitis. Data are representative of four to five patients per group. (C) Immunohistochemical double staining analysis of the cellular expression of T-bet plus CD3 in consecutive cross sections. Cryosections from patients with Crohn's disease (n = 10), ulcerative colitis (n = 4) and control patients (n = 8) were stained with antibodies to CD3 and T-bet, as indicated. One representative experiment is shown. Double positive cells are indicated by arrows. (D) Quantitative analysis of T-bet-positive CD3+ LP T cells in patients with Crohn's disease, ulcerative colitis, and control patients. The percentage of double-positive T cells in four to six patients per group was quantified as specified in Materials and Methods. Data represents mean values ± SD. (E) Analysis of T-bet expression by LPMCs from patients with Crohn's disease and control patients. Nuclei were counterstained with DAPI, as specified in Materials and Methods. Most T cells from control patients showed weak expression of T-bet in perinuclear areas, whereas high cytoplasmic and nuclear expression was noted in patients with Crohn's disease. (F) Double staining analysis for GATA-3 and CD3 in the LP of patients with Crohn's disease (CD) and control patients (con), as indicated. Colon cryosection were stained with a polyclonal anti–GATA-3 antibody and anti-CD3 antibodies. There was a marked reduction of GATA-3 expression in LP T cells from patients with Crohn's disease compared with control patients. Data are representative of four to six patients per group. Cytospins from PMA- plus ionomycin-stimulated peripheral blood T cells served as a positive control.
Figure 2.
Figure 2.
Increased nuclear expression of T-bet in LP T cells from patients with Crohn's disease. (A) EMSA using nuclear extracts of purified LP T cells from Crohn's disease and control patients and a radiolabeled T-bet DNA binding site. The location of the T-bet signal is indicated. (B) Auto- and cross-competition assay. Specificity of the EMSA signal obtained with the T-bet–binding site was shown by autocompetition with unlabeled T-bet binding site, whereas cross-competition with unlabeled SP-1, μE5, and AP-2 sites did not affect the signal. (C) Analysis of T-bet expression in nuclear extracts of LP T cells (Crohn's disease: n = 3; controls: n = 2) by Western blot analysis. A high expression of T-bet was observed in patients with Crohn's disease but not control patients. A second independent experiments with four patients per group showed similar results (data not shown). (D) Intracellular staining for STAT-1 and T-bet by FACS® using LP cells from patients with Crohn's disease or control patients, as indicated. One representative experiment out of three is shown.
Figure 2.
Figure 2.
Increased nuclear expression of T-bet in LP T cells from patients with Crohn's disease. (A) EMSA using nuclear extracts of purified LP T cells from Crohn's disease and control patients and a radiolabeled T-bet DNA binding site. The location of the T-bet signal is indicated. (B) Auto- and cross-competition assay. Specificity of the EMSA signal obtained with the T-bet–binding site was shown by autocompetition with unlabeled T-bet binding site, whereas cross-competition with unlabeled SP-1, μE5, and AP-2 sites did not affect the signal. (C) Analysis of T-bet expression in nuclear extracts of LP T cells (Crohn's disease: n = 3; controls: n = 2) by Western blot analysis. A high expression of T-bet was observed in patients with Crohn's disease but not control patients. A second independent experiments with four patients per group showed similar results (data not shown). (D) Intracellular staining for STAT-1 and T-bet by FACS® using LP cells from patients with Crohn's disease or control patients, as indicated. One representative experiment out of three is shown.
Figure 3.
Figure 3.
Increased expression of T-bet in Th1- but not Th2-mediated animal models of chronic intestinal inflammation A. Analysis of T-bet expression in C.B.-17 SCID mice reconstituted with 106 CD62L+ CD4+ T cells from Balb/c mice. EMSA for T-bet using nuclear (NUC) and cytoplasmic (CYT) extracts from spleen cells of unreconstituted and CD62L+ CD4+ T cell reconstituted SCID mice at indicated time points. SCID mice showed clinical signs of colitis 8–9 wk after T cell transfer. (B) Supershift assay for T-bet using nuclear extract from spleen cells of SCID mice 6 wk after reconstitution with CD62L+ CD4+ T cells from Balb/c mice. (C) Immunohistochemical analysis of the colon of SCID mice for T-bet expression at indicated time points after reconstitution with CD62L+ CD4+ T cells. T-bet expressing cells in the LP were noted as soon as 3 wk after T cell transfer. (D) Expression of T-bet in extracts from LPMCs in Th1- and Th2-mediated animal models of chronic intestinal inflammation. Whereas increased T-bet expression by Western blot analysis was noted in Th1-mediated models such as TNBS-induced colitis in Balb/c mice and colitis in 4–12-wk-old IL-10 knockout mice, both oxazolone-induced colitis and TCR-α−/− μ−/− colitis were associated with normal or reduced T-bet expression in LPMCs.
Figure 4.
Figure 4.
Overexpression of T-bet accelerates development of Th1-mediated colitis. (A) Transfer of T-bet transduced CD62L+ CD4+ T cells causes rapid onset of colitis in SCID mice. Splenic CD4+ T cells from Balb/c mice were isolated and infected with the T-bet retrovirus followed by FACS® sorting for GFP/CD62L double positive T cells. GFP+ CD62L+ CD4+ T cells were then injected into C.B.-17 SCID mice followed by monitoring of the body weight at indicated time points after cell transfer. Data represent mean values ± SEM. Two independent experiments are shown (right and left). (B) Rectal prolapse upon reconstitution of SCID mice with T-bet transduced (T-bet RV – lower panel) and control transduced (CON-RV, top panel) CD62L+ T cells. The development of a marked rectal prolapse was noted much earlier in the former than in the latter group. (C) Macroscopic evidence of colitis in SCID mice reconstituted with T-bet transduced (T-bet RV, bottom panel) and control transduced (CON-RV, top panel) CD62L+ T cells as compared with an unreconstituted SCID mouse. (D) Western blot analysis for T-bet expression in T-bet transduced versus control transduced T cells before the T cell transfer. As expected, retroviral infection with the T-bet virus led to much higher T-bet levels in the T cells as compared with control infected T cells. The β-actin staining served as loading control.
Figure 4.
Figure 4.
Overexpression of T-bet accelerates development of Th1-mediated colitis. (A) Transfer of T-bet transduced CD62L+ CD4+ T cells causes rapid onset of colitis in SCID mice. Splenic CD4+ T cells from Balb/c mice were isolated and infected with the T-bet retrovirus followed by FACS® sorting for GFP/CD62L double positive T cells. GFP+ CD62L+ CD4+ T cells were then injected into C.B.-17 SCID mice followed by monitoring of the body weight at indicated time points after cell transfer. Data represent mean values ± SEM. Two independent experiments are shown (right and left). (B) Rectal prolapse upon reconstitution of SCID mice with T-bet transduced (T-bet RV – lower panel) and control transduced (CON-RV, top panel) CD62L+ T cells. The development of a marked rectal prolapse was noted much earlier in the former than in the latter group. (C) Macroscopic evidence of colitis in SCID mice reconstituted with T-bet transduced (T-bet RV, bottom panel) and control transduced (CON-RV, top panel) CD62L+ T cells as compared with an unreconstituted SCID mouse. (D) Western blot analysis for T-bet expression in T-bet transduced versus control transduced T cells before the T cell transfer. As expected, retroviral infection with the T-bet virus led to much higher T-bet levels in the T cells as compared with control infected T cells. The β-actin staining served as loading control.
Figure 5.
Figure 5.
T-bet–deficient mice show enhanced susceptibility to oxazolone-induced colitis. (A) T-bet wild-type (WT), heterozygous (HET) and knockout mice (KO) were sensitized to oxazolone followed by intrarectal treatment with 1% oxazolone in 50% ethanol after 1 wk and monitoring of body weight (left). Data are given as mean values ± SEM and represent six to eight mice per group. Significant differences are indicated (*P < 0.05). In addition, ear thickness after local oxazolone challenge was determined in sensitized animals, as specified in Materials and Methods (right). Data are given as mean values ± SEM and represent six to eight mice per group. No significant differences were noted. (B and C) Macroscopic and histologic analysis of the colon of T-bet wild-type and knockout mice 7 d after intrarectal administration of oxazolone. One representative colon per group is shown. There was a marked inflammation of the mucosa and submucosa in T-bet–deficient mice associated with edema, hypervascularization, and ulcer formation (arrowhead in bottom left panel) that was more pronounced compared with wild-type animals. (D) Histopathologic assessment of colitis activity in wild-type and T-bet–deficient mice given oxazolone. Paraffin sections were scored in a blinded fashion, as described in Materials and Methods. Data are given mean values ± SEM and represent six to eight mice per group. (E) Cytokine production by splenic CD3+ T cells from oxazolone-treated mice. T cells were stimulated with antibodies to CD3 and CD28 followed by analysis of culture supernatants by ELISA. Data represent four to eight mice per group and are given as mean values ± SEM. A marked induction of IL-4 production was seen in T-bet–deficient mice. No marked changes in IFN-γ production by CD3+ T cells were detected probably due to the fact that IFN-γ production from T-bet–deficient CD8+ T cells is unimpaired (reference 47). (F) Anti–IL-4 treatment suppresses colitis activity in T-bet knockout mice. T-bet knockout mice were sensitized to oxazolone followed by intraperitoneal administration of neutralizing anti–IL-4 antibodies and intrarectal oxazolone treatment. Colon samples were obtained after 7 d followed by histopathologic analysis. Data represent three to four mice per group and are given as mean values ± SEM.
Figure 5.
Figure 5.
T-bet–deficient mice show enhanced susceptibility to oxazolone-induced colitis. (A) T-bet wild-type (WT), heterozygous (HET) and knockout mice (KO) were sensitized to oxazolone followed by intrarectal treatment with 1% oxazolone in 50% ethanol after 1 wk and monitoring of body weight (left). Data are given as mean values ± SEM and represent six to eight mice per group. Significant differences are indicated (*P < 0.05). In addition, ear thickness after local oxazolone challenge was determined in sensitized animals, as specified in Materials and Methods (right). Data are given as mean values ± SEM and represent six to eight mice per group. No significant differences were noted. (B and C) Macroscopic and histologic analysis of the colon of T-bet wild-type and knockout mice 7 d after intrarectal administration of oxazolone. One representative colon per group is shown. There was a marked inflammation of the mucosa and submucosa in T-bet–deficient mice associated with edema, hypervascularization, and ulcer formation (arrowhead in bottom left panel) that was more pronounced compared with wild-type animals. (D) Histopathologic assessment of colitis activity in wild-type and T-bet–deficient mice given oxazolone. Paraffin sections were scored in a blinded fashion, as described in Materials and Methods. Data are given mean values ± SEM and represent six to eight mice per group. (E) Cytokine production by splenic CD3+ T cells from oxazolone-treated mice. T cells were stimulated with antibodies to CD3 and CD28 followed by analysis of culture supernatants by ELISA. Data represent four to eight mice per group and are given as mean values ± SEM. A marked induction of IL-4 production was seen in T-bet–deficient mice. No marked changes in IFN-γ production by CD3+ T cells were detected probably due to the fact that IFN-γ production from T-bet–deficient CD8+ T cells is unimpaired (reference 47). (F) Anti–IL-4 treatment suppresses colitis activity in T-bet knockout mice. T-bet knockout mice were sensitized to oxazolone followed by intraperitoneal administration of neutralizing anti–IL-4 antibodies and intrarectal oxazolone treatment. Colon samples were obtained after 7 d followed by histopathologic analysis. Data represent three to four mice per group and are given as mean values ± SEM.
Figure 6.
Figure 6.
T-bet deficiency protects from Th1-mediated colitis induced by CD62L+ CD4+ T cell transfer in immunocompromised mice. Immunocompromised mice were reconstituted with CD62L+ CD4+ T cells from wild-type and T-bet–deficient mice. In contrast to mice reconstituted with cells from wild-type animals, mice injected with CD62L+ CD4+ T cells from T-bet knockout mice showed neither wasting disease (A) nor rectal prolaps (B) and macroscopic (C) or endoscopic (D) signs of inflammation. A shows weight data (mean values ± SEM) from one representative experiment out of three and represents data from five to six mice per group. C shows one representative colon and spleen per group 8 wk after the T cell transfer. A significant reduction in endoscopic severity of colitis was noted in mice reconstituted with CD62L+ CD4+ T cells lacking T-bet compared with cells from wild-type mice (D; P < 0.05). In particular, no bleeding ulcers and erosions were noted in the former mice that were frequently present after transfer of CD62L+ CD4+ T cells from wild-type mice (left panels in D). Furthermore, there was a striking reduction of cell infiltration in the colon in mice reconstituted with T-bet–deficient T cells compared with mice reconstituted with T cells from wild-type mice (E). Quantitative histopathologic assessment of colitis activity showed a highly significant (**P < 0.01; ***P < 0.0001) suppression of both the inflammation and injury score in mice reconstituted with CD62L+ CD4+ T cells lacking T-bet compared with cells from wild-type mice (F). Data were pooled from three independent experiments with at least five mice per group (n = 19–23 per group) and are stated as mean values ± SEM. In addition, cytokine production by splenic CD4+ T cells was assessed before and 8 wk after the T cell transfer. T cells were stimulated with anti-CD3 plus CD28 antibodies and cytokine concentrations were determined by specific ELISA after 2 d. Data are shown as mean values ± SEM (G).
Figure 6.
Figure 6.
T-bet deficiency protects from Th1-mediated colitis induced by CD62L+ CD4+ T cell transfer in immunocompromised mice. Immunocompromised mice were reconstituted with CD62L+ CD4+ T cells from wild-type and T-bet–deficient mice. In contrast to mice reconstituted with cells from wild-type animals, mice injected with CD62L+ CD4+ T cells from T-bet knockout mice showed neither wasting disease (A) nor rectal prolaps (B) and macroscopic (C) or endoscopic (D) signs of inflammation. A shows weight data (mean values ± SEM) from one representative experiment out of three and represents data from five to six mice per group. C shows one representative colon and spleen per group 8 wk after the T cell transfer. A significant reduction in endoscopic severity of colitis was noted in mice reconstituted with CD62L+ CD4+ T cells lacking T-bet compared with cells from wild-type mice (D; P < 0.05). In particular, no bleeding ulcers and erosions were noted in the former mice that were frequently present after transfer of CD62L+ CD4+ T cells from wild-type mice (left panels in D). Furthermore, there was a striking reduction of cell infiltration in the colon in mice reconstituted with T-bet–deficient T cells compared with mice reconstituted with T cells from wild-type mice (E). Quantitative histopathologic assessment of colitis activity showed a highly significant (**P < 0.01; ***P < 0.0001) suppression of both the inflammation and injury score in mice reconstituted with CD62L+ CD4+ T cells lacking T-bet compared with cells from wild-type mice (F). Data were pooled from three independent experiments with at least five mice per group (n = 19–23 per group) and are stated as mean values ± SEM. In addition, cytokine production by splenic CD4+ T cells was assessed before and 8 wk after the T cell transfer. T cells were stimulated with anti-CD3 plus CD28 antibodies and cytokine concentrations were determined by specific ELISA after 2 d. Data are shown as mean values ± SEM (G).
Figure 7.
Figure 7.
Changes in Th1 and Th2 cytokine production by LP cells in T-bet–deficient mice. (A) Histologic analysis of the large bowel of T-bet knockout mice (KO), heterozygous mice (HET), and wild-type littermates (WT). There was no evidence for colitis in T-bet–deficient animals. Similarly, no evidence of intestinal inflammation was observed in the small bowel (data not shown). (B) T cell–enriched LPMCs were isolated from the small and large bowel of wild-type (WT) and T-bet–deficient (KO) mice as well as from heterozygous (HET) mice and stimulated with antibodies to CD3 and CD28. Supernatants were taken after 48 h and analyzed for cytokine content by specific ELISA. Two representative experiments (experiment 1: red bars; experiment 2: purple bars) out of four are shown. (C) Western blot analysis and EMSA analysis for GATA-3 expression in nuclear extracts of LPMC from wild-type and T-bet–deficient mice. There was an increased expression of GATA-3 in LPMCs from T-bet knockout mice. The staining for β-actin and the EMSA for SP1 served as loading controls.
Figure 8.
Figure 8.
The enhanced protective capacity of CD62L CD4+ T cells from T-bet knockout mice is associated with increased production of TGF-β and TGF-β signaling. (A) TGF-β downregulates T-bet expression in T cell–enriched LPMCs. Cells were cultured in the presence of antibodies to CD3 and CD28 with or without recombinant IL-4 and TGF-β (1 ng/ml). Cellular extracts were made after 48 h and analyzed for the expression of T-bet and β-actin by Western blot analysis. (B) TGF-β production by T cell–enriched LPMCs from wild-type (WT), T-bet heterozygous (HET), and T-bet knockout (KO) mice in the absence of colitogenic stimuli. Cells were stimulated with antibodies to CD3 plus CD28 and supernatants were analyzed by ELISA. (C) T-bet expression in splenic CD25+, CD62L+, CD4+, and CD62L CD4+ T cells from healthy wild-type mice. Cytoplasmic (CYT) and nuclear (NUC) extracts from these cells were isolated and analyzed for T-bet expression by Western blotting. (D) Evidence for increased TGF-β–mediated signaling in T-bet–deficient CD4+ T cells. CD4+ T cells from wild-type and T-bet knockout mice were stimulated with anti-CD3 plus anti-CD28 and rIFN-γ for 12 h followed by protein extraction and Western blot analysis. Cellular extracts were analyzed for Smad7 expression whereas nuclear and cytoplasmic extracts from CD4+ T cells were analyzed for Smad3 levels. (E) Inflammation score of mice reconstituted with CD62L+ CD4+ T cells from wild-type mice and CD62L CD4+ T cells from T-bet knockout mice (KO) and wild-type (WT) control mice. Data represent three to four mice per group and are given as mean values ± SEM. (F) FACS® analysis of splenic CD4+ T cells from mice reconstituted with CD62L+ CD4+ T cells from wild-type mice plus CD62L CD4+ T cells from T-bet knockout mice (KO) or wild-type (WT) control mice. One representative experiment is shown. (G) TGF-β production by LPMCs from the above reconstituted mice. Cells were stimulated with antibodies to CD3 plus CD28 in serum free medium and supernatants were collected after 3 d followed by analysis of supernatants by ELISA. Data represent mean values ± SEM.
Figure 8.
Figure 8.
The enhanced protective capacity of CD62L CD4+ T cells from T-bet knockout mice is associated with increased production of TGF-β and TGF-β signaling. (A) TGF-β downregulates T-bet expression in T cell–enriched LPMCs. Cells were cultured in the presence of antibodies to CD3 and CD28 with or without recombinant IL-4 and TGF-β (1 ng/ml). Cellular extracts were made after 48 h and analyzed for the expression of T-bet and β-actin by Western blot analysis. (B) TGF-β production by T cell–enriched LPMCs from wild-type (WT), T-bet heterozygous (HET), and T-bet knockout (KO) mice in the absence of colitogenic stimuli. Cells were stimulated with antibodies to CD3 plus CD28 and supernatants were analyzed by ELISA. (C) T-bet expression in splenic CD25+, CD62L+, CD4+, and CD62L CD4+ T cells from healthy wild-type mice. Cytoplasmic (CYT) and nuclear (NUC) extracts from these cells were isolated and analyzed for T-bet expression by Western blotting. (D) Evidence for increased TGF-β–mediated signaling in T-bet–deficient CD4+ T cells. CD4+ T cells from wild-type and T-bet knockout mice were stimulated with anti-CD3 plus anti-CD28 and rIFN-γ for 12 h followed by protein extraction and Western blot analysis. Cellular extracts were analyzed for Smad7 expression whereas nuclear and cytoplasmic extracts from CD4+ T cells were analyzed for Smad3 levels. (E) Inflammation score of mice reconstituted with CD62L+ CD4+ T cells from wild-type mice and CD62L CD4+ T cells from T-bet knockout mice (KO) and wild-type (WT) control mice. Data represent three to four mice per group and are given as mean values ± SEM. (F) FACS® analysis of splenic CD4+ T cells from mice reconstituted with CD62L+ CD4+ T cells from wild-type mice plus CD62L CD4+ T cells from T-bet knockout mice (KO) or wild-type (WT) control mice. One representative experiment is shown. (G) TGF-β production by LPMCs from the above reconstituted mice. Cells were stimulated with antibodies to CD3 plus CD28 in serum free medium and supernatants were collected after 3 d followed by analysis of supernatants by ELISA. Data represent mean values ± SEM.
Figure 9.
Figure 9.
A regulatory role for T-bet in mucosal cytokine production. T-bet controls Th1 and Th2 cytokine production in colitis and its levels are downregulated by TGF-β. On the other hand, downregulation of T-bet is associated with increased TGF-β levels possibly due to failure of T-bet–mediated activation of Smad7.

References

    1. Podolsky, D.K. 1991. Inflammatory bowel disease. N. Engl. J. Med. 325:928–937. - PubMed
    1. Neurath, M.F., S. Finotto, and W. Strober. 2001. Immunology of inflammatory bowel disease. Clinical Immunology. 2nd edition. In press. - PubMed
    1. Blumberg, R.S., L.J. Saubermann, and W. Strober. 1999. Animal models of mucosal inflammation and their relation to human inflammatory bowel disease. Curr. Opin. Immunol. 11:648–656. - PubMed
    1. Friedman, S., and R.S. Blumberg. 1999. Inflammatory bowel disease. Harrison's Principles of Internal Medicine. 15th edition. McGraw-Hill, New York. 1679–1691.
    1. Duchmann, R., and M. Zeitz. 1998. Crohn's disease. Handbook of Mucosal Immunology. P. Ogra and W. Strober, editors. Academic Press, NY. 1055–1080.

Publication types

MeSH terms