Comparative Study
. 2002 May;12(5):713-28.
doi: 10.1101/gr.73702.

Genes in a refined Smith-Magenis syndrome critical deletion interval on chromosome 17p11.2 and the syntenic region of the mouse

Affiliations
Comparative Study

Genes in a refined Smith-Magenis syndrome critical deletion interval on chromosome 17p11.2 and the syntenic region of the mouse

Weimin Bi et al. Genome Res. 2002 May.

Abstract

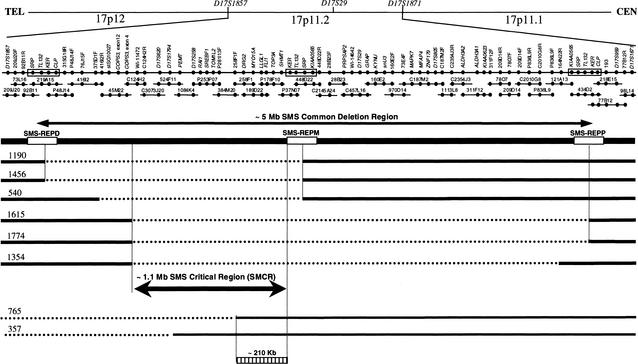
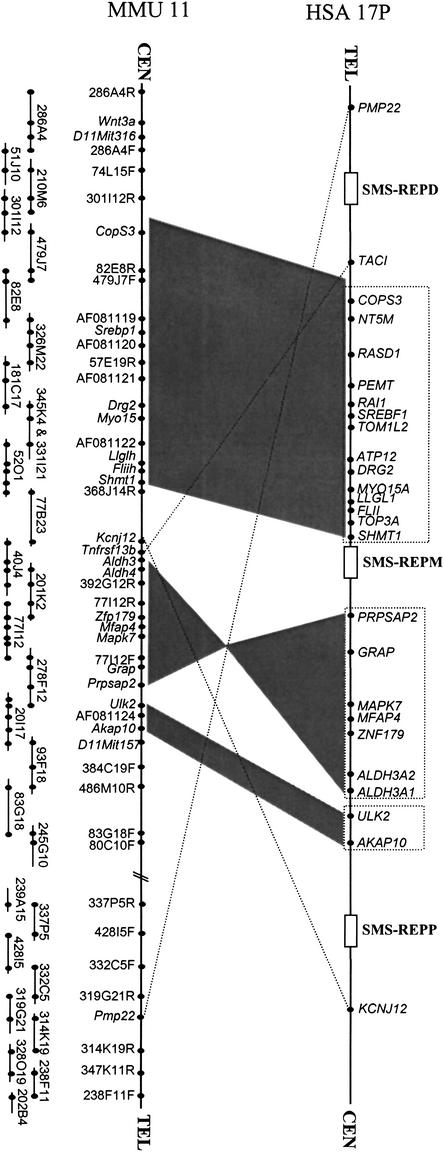
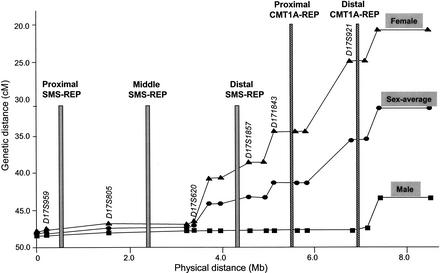
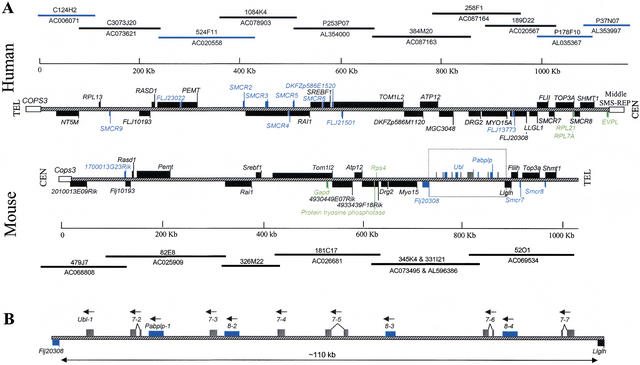
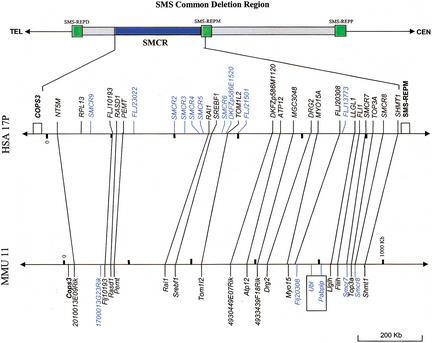
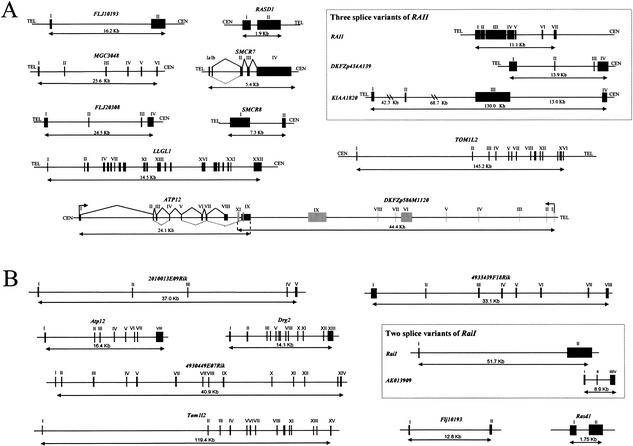
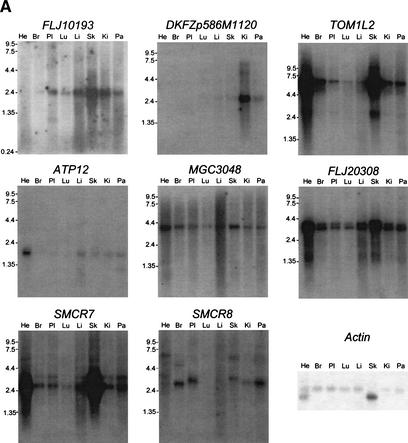
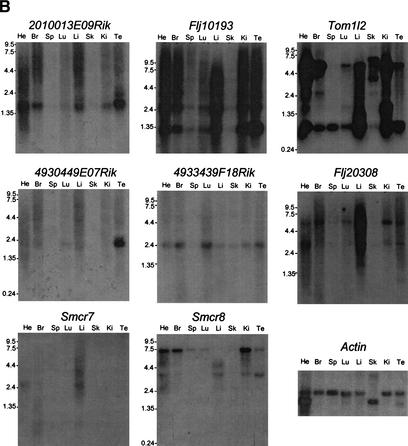
Smith-Magenis syndrome (SMS) is a multiple congenital anomaly/mental retardation syndrome associated with behavioral abnormalities and sleep disturbance. Most patients have the same approximately 4 Mb interstitial genomic deletion within chromosome 17p11.2. To investigate the molecular bases of the SMS phenotype, we constructed BAC/PAC contigs covering the SMS common deletion interval and its syntenic region on mouse chromosome 11. Comparative genome analysis reveals the absence of all three approximately 200-kb SMS-REP low-copy repeats in the mouse and indicates that the evolution of SMS-REPs was accompanied by transposition of adjacent genes. Physical and genetic map comparisons in humans reveal reduced recombination in both sexes. Moreover, by examining the deleted regions in SMS patients with unusual-sized deletions, we refined the minimal Smith-Magenis critical region (SMCR) to an approximately 1.1-Mb genomic interval that is syntenic to an approxiamtely 1.0-Mb region in the mouse. Genes within the SMCR and its mouse syntenic region were identified by homology searches and by gene prediction programs, and their gene structures and expression profiles were characterized. In addition to 12 genes previously mapped, we identified 8 new genes and 10 predicted genes in the SMCR. In the mouse syntenic region of the human SMCR, 16 genes and 6 predicted genes were identified. The SMCR is highly conserved between humans and mice, including 19 genes with the same gene order and orientation. Our findings will facilitate both the identification of gene(s) responsible for the SMS phenotype and the engineering of an SMS mouse model.


Figures

Figure 1
Figure 1
The Smith-Magenis critical region (SMCR) refined by breakpoint studies of patients with deletions in 17p11.2. The SMS common deletion region falls between D17S959 and D17S1857, including SMS-REPs. Above are shown genetic markers and the cytogenetic bands on 17p. TEL represents telomeric orientation, and CEN represents centromeric orientation. The minimum BAC/PAC tiling path of the SMS common deletion region is shown toward the top of the figure, with STS-content markers represented by dots and BAC/PAC clones represented by horizontal bars. Clones without a prefix are BACs from RPCI-11; those with prefix P are PAC clones; those with prefix C are CTD clones. BAC end sequences were used as markers with R representing the BAC end sequence derived from the Sp6 primer, and F representing the sequence from the T7 primer. Above the BAC contig are listed the individual genes and genetic markers from this region. Below, patients are identified by number. The deleted region is indicated by dashed lines, whereas bold lines refer to genomic sequences retained. The distal breakpoints of patients 357 and 765 are outside the SMS common deleted region. The refined ∼1.1-Mb SMCR (double-edged bold arrow) and the ∼210 kb (hatched box) inside the SMCR, but not deleted in patient 765, are indicated.
Figure 2
Figure 2
Comparison of the gene order in the human SMS common deletion region and its mouse syntenic region. Genes within the human SMS region on 17p11.2 are shown above. Open boxes represent the SMS-REPs. Below is shown the minimum BAC tiling path of the mouse syntenic region of the SMS common deletion interval and its flanking region. Each BAC clone is represented by a horizontal bar with STS-content markers represented by dots. Blocks of genes that show linkage conservation (i.e., identical gene order) in humans and mice are boxed and connected via gray shading.
Figure 3
Figure 3
Comparison between genetic and physical maps. The STR genetic markers from Marshfield are aligned to the sequence-based physical map. The marker order is as following: D17S1871, D17S959, D17S805, D17S1794, D17S620, D17S740, D17S2196, D17S1857, D17S953, D17S1843, D17S793, D17S918, D17S921, D17S1856, D17S947, and D17S1803 (markers within the SMS region are underlined). The three SMS-REPs are indicated by gray bars, the two CMT1A-REPs by hatched bars. Reduced recombination in both sexes was observed for most of the SMS region.
Figure 4
Figure 4
Transcript map of the SMCR and its mouse syntenic region. The BAC and PAC clones are identified by name and accession number. (A) Clones without a prefix are BACs from RPCI-11 (human) or from RPCI-23 (mouse); those with prefix P are PAC clones; those with prefix C are CTD clones. The hatched line represents the SMCR, and the open boxes represent the flanking sequences of the SMCR: COPS3 and the middle SMS-REP. The position 0 on the size scale is assigned to the nucleotide proximal to the putative promoter of the COPS3 gene. Genes inside SMCR are represented by black boxes, predicted genes by blue boxes, and pseudogenes by green boxes. The predicted genes Ubl and Pabplp are located between Flj20308 and Llglh, and both are present as a gene cluster. To distinguish from Pabplp, gray boxes were used to represent the Ubl. Human genes transcribed from centromere to telomere are located above the central line, and genes transcribed from telomere to centromere are below the line. The mouse genes are drawn in the reciprocal manner (i.e., genes transcribed from telomere to centromere are above the central line). (B) The structure of the ∼110-kb gene clusters between Flj20308 and Llghl that is boxed in A. Seven copies of Ubl and four copies of Pabplp are intermixed. Solid lines connecting exons represent the splicing pattern. All copies are potentially transcribed in the same direction (arrows). The Ubl gene appears to have four copies with spliced variants.
Figure 5
Figure 5
Comparison of the order of the putative genes in the SMCR and the mouse syntenic region. The open boxes represent the flanking sequences of the SMCR: COPS3 and the middle SMS-REP. Genes are in black, and predicted genes are in blue. Genes in the SMCR are connected with their mouse homologs by lines. The region that contains two mouse gene clusters that are not inside the SMCR is boxed. The location of the SMCR in the common deletion region is indicated at the top.
Figure 6
Figure 6
Genomic structure of the genes in the SMCR (A) and in the mouse syntenic region (B). Exons of DKFZp586M1120 are represented by gray boxes; exons of other genes are represented by black boxes. Alternative splicing is observed for RAI1, ATP12, and SMCR7. Dashed lines connecting exons represent the alternative splicing. Exon 10 of DKFZp586M1120 is located inside exon 6 of the ATP12 splice variant. Arrows indicate the orientation of transcription. The introns 2 and 3 of KIAA1820 are not to scale.
Figure 7
Figure 7
Northern blotting of the genes in the SMCR (A) and the genes in its mouse syntenic region (B). Tissues are indicated at the top of each lane, and the size markers in kilobases (kb) are the numbers beside the blots. (He) heart; (Br) brain; (Pl) placenta; (Lu) lung; (Li) liver; (Sk) skeletal muscle; (Ki) kidney; (Pa) pancreas; (Te) testis. For mRNA quantity, β-actin was probed as a control. Ubiquitous expression was observed for FLJ10193, MGC3048, FLJ20308, and SMCR7. Tissue-specific various-sized transcripts were observed for TOM1L2 and SMCR8. DKFZp586M1120 is predominantly expressed in the kidney, whereas 4930449E07Rik is in the testis.
Figure 7
Figure 7
Northern blotting of the genes in the SMCR (A) and the genes in its mouse syntenic region (B). Tissues are indicated at the top of each lane, and the size markers in kilobases (kb) are the numbers beside the blots. (He) heart; (Br) brain; (Pl) placenta; (Lu) lung; (Li) liver; (Sk) skeletal muscle; (Ki) kidney; (Pa) pancreas; (Te) testis. For mRNA quantity, β-actin was probed as a control. Ubiquitous expression was observed for FLJ10193, MGC3048, FLJ20308, and SMCR7. Tissue-specific various-sized transcripts were observed for TOM1L2 and SMCR8. DKFZp586M1120 is predominantly expressed in the kidney, whereas 4930449E07Rik is in the testis.

References

    1. Amid C, Bahr A, Mujica A, Sampson N, Bikar S-E, Winterpacht A, Zabel B, Hankeln T, Schmidt ER. Comparative genomic sequencing reveals a strikingly similar architecture of a conserved syntenic region on human chromosome 11p15.3 (including gene ST5) and mouse chromosome 7. Cytogenet Cell Genet. 2001;93:284–290. - PubMed
    1. Ansari-Lari MA, Oeltjen JC, Schwartz S, Zhang Z, Muzny DM, Lu J, Gorrell JH, Chinault AC, Belmont JW, Miller W, et al. Comparative sequence analysis of a gene-rich cluster at human chromosome 12p13 and its syntenic region in mouse chromosome 6. Genome Res. 1998;8:29–40. - PubMed
    1. Baker RT, Board PG. The human ubiquitin/52-residue ribosomal protein fusion gene subfamily (UbA52) is composed primarily of processed pseudogenes. Genomics. 1992;14:520–522. - PubMed
    1. Beamer LJ, Carroll SF, Eisenberg D. Crystal structure of human BPI and two bound phospholipids at 2.4 angstrom resolution. Science. 1997;276:1861–1864. - PubMed
    1. Cai W-W, Reneker J, Chow C-W, Vaishnav M, Bradley A. An anchored framework BAC map of mouse chromosome 11 assembled using multiplex oligonucleotide hybridization. Genomics. 1998;54:387–397. - PubMed

Publication types

MeSH terms