. 2002 May 14;99(10):6725-30.
doi: 10.1073/pnas.062565599. Epub 2002 May 7.

Single-molecule height measurements on microsomal cytochrome P450 in nanometer-scale phospholipid bilayer disks

Affiliations

Single-molecule height measurements on microsomal cytochrome P450 in nanometer-scale phospholipid bilayer disks

Timothy H Bayburt et al. Proc Natl Acad Sci U S A. .

Abstract

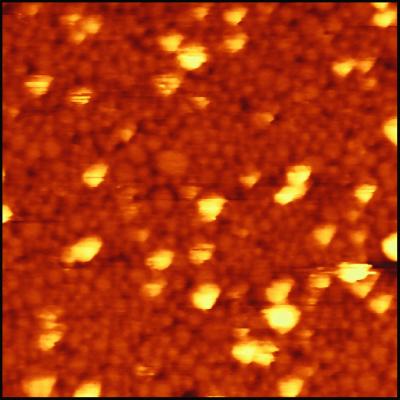
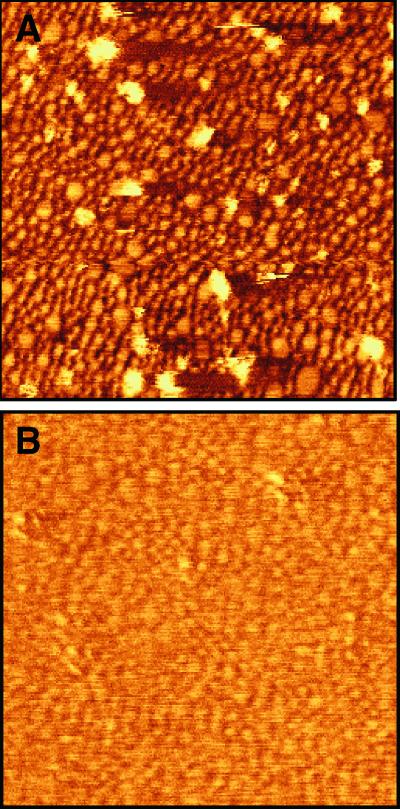
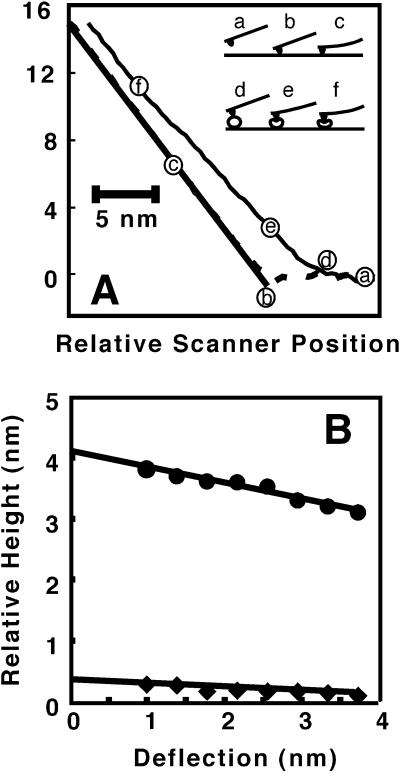
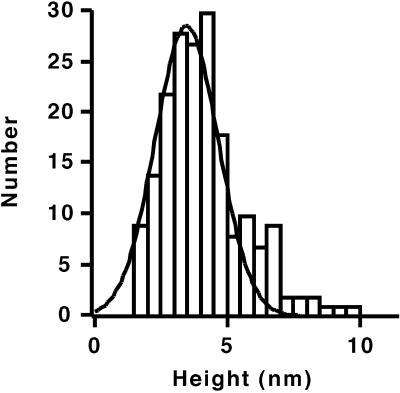
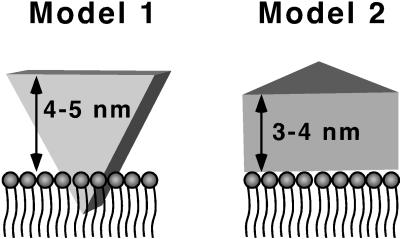
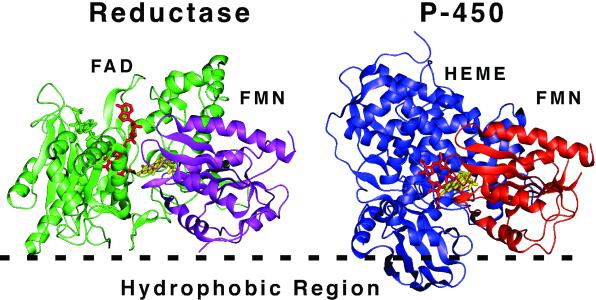
The architecture of membrane proteins in their native environment of the phospholipid bilayer is critical for understanding physiological function, but has been difficult to realize experimentally. In this communication we describe the incorporation of a membrane-anchored protein into a supported phospholipid bilayer. Cytochrome P450 2B4 solubilized and purified from the hepatic endoplasmic reticulum was incorporated into phospholipid bilayer nanostructures and oriented on a surface for visualization by atomic force microscopy. Individual P450 molecules were observed protruding from the bilayer surface. Problems associated with deformation of the protein by the atomic force microscopy probe were avoided by analyzing force-dependent height measurements to quantitate the height of the protein above the bilayer surface. Measurements of the atomic force microscopy cantilever deflection as a function of probe-sample separation reveal that the top of the P450 opposite the N-terminal membrane anchor region sits 3.5 nanometers above the phospholipid-water boundary. Models of the orientation of the enzyme are presented and discussed in relation to membrane interactions and interaction with cytochrome P450 reductase.


Figures

Figure 1
Figure 1
Native polyacrylamide gradient gel electrophoresis of rHDL/CYP2B4. Dialysate containing rHDL and CYP2B4 was run on an 8–25% gradient gel and stained with Coomassie brilliant blue. The sizes of the rHDL structures were estimated from the known hydrodynamic diameters of the protein standards.
Figure 2
Figure 2
Height image of cytochrome P450 at the rHDL surface. The rHDL/CYP2B4 complex was isolated by gel filtration and applied to a freshly cleaved mica surface as described in Materials and Methods. The image was obtained in contact mode. The image size is 500 × 500 nm.
Figure 3
Figure 3
Images of CYP2B4 before (A) and after (B) in situ treatment with 15 μg/ml trypsin. The image in B was taken approximately 10 min after addition of trypsin. Images are contact images in deflection mode. The image size is 500 × 500 nm.
Figure 4
Figure 4
(A) Force curve in approach direction taken on a cytochrome P450 molecule (thin line), rHDL surface (dashed line), and theoretical hard surface (thick line). Curves are averages of several force curves. (Inset) Regions of force curves on a hard surface [(a) noncontact, (b) point of contact, and (c) region of constant compliance] and on a protein [(d) region of contact with protein, (e) deformation, and (f) region of constant compliance]. (B) Relative height as a function of cantilever deflection. Lines are least squares fits with intercepts of 0.39 ± 0.03 nm (rHDL) and 4.13 ± 0.06 nm (CYP2B4) giving an extrapolated height for CYP2B4 above the rHDL surface of 3.74 ± 0.07 nm.
Figure 5
Figure 5
Histogram of the height of cytochrome P450 molecules above the rHDL surface measured by extrapolation to zero cantilever deflection. The solid line is a Gaussian fit having a peak at 3.5 nm with a SD of 0.9 nm. Data were taken for 191 cytochrome P450 molecules from 12 areas of a sample. Relative heights were linearly extrapolated to cantilever deflection values of zero, using four points of the height vs. deflection curves at cantilever deflections between 1 and 3 nm. The relative height of the rHDL surface was subtracted from the relative height of cytochrome P450 to obtain the height of cytochrome P450 above the rHDL surface.
Figure 6
Figure 6
Schematic of P450 interacting with the phospholipid bilayer domain of rHDL. In Model 1, a hydrophobic tip is inserted into the membrane and the heme is perpendicular to the membrane. In Model 2, the enzyme is lying on its distal face with the heme parallel to the membrane. The transmembrane anchor domain is not shown.
Figure 7
Figure 7
Theoretical model structure of CYP2B4 showing surfaces distal and proximal to the heme thiolate ligand. The membrane anchor is not shown. The regions colored yellow are segments corresponding to regions in the CYP2C5 structure reported to be hydrophobic (2). Segments colored red are anti-peptide antibody binding epitopes known to bind the membrane-bound form of CYP2B4 or CYP2B5. Residues colored blue are believed to be involved in electrostatic interaction with P450 reductase.
Figure 8
Figure 8
Possible orientation of redox transfer complexes on the membrane surface. Cytochrome P450 reductase is shown based on the probable orientation of the reductase at a membrane surface (hydrophobic region). Cytochrome P450 was oriented such that the FMN domain (orange) of the known structure of bacterial cytochrome P450 CYP102 is roughly superimposable on the FMN domain of P450 reductase (purple). The resulting orientation of cytochrome P450 with respect to the membrane corresponds to Model 1 of Fig. 6. Note that whereas the FMN (yellow) of reductase accepts electrons from FAD (green), in the P450 structure the FMN (yellow) is in close proximity to the heme cofactor (red). The structures of reductase (PDB ID 1AMO) and CYP102 (PDB ID 1BVY) were obtained from the Protein Data Bank, www.rcsb.org.

References

    1. Ortiz de Montellano P R. Cytochrome P-450: Structure, Mechanism, and Biochemistry. New York: Plenum; 1986.
    1. Williams P A, Cosme J, Sridhar V, Johnson E F, McRee D E. Mol Cell. 2000;5:121–131. - PubMed
    1. Strobel H W, Lu A Y, Heidema J, Coon M J. J Biol Chem. 1970;245:4851–4854. - PubMed
    1. Ingelman-Sundberg M, Haaparanta T, Rydstrom J. Biochemistry. 1981;20:4100–4106. - PubMed
    1. Ingelman-Sundberg M, Blanck J, Smettan G, Ruckpaul K. Eur J Biochem. 1983;134:157–162. - PubMed

Publication types

MeSH terms

LinkOut - more resources