

Genome-wide screening for trait conferring genes using DNA microarrays
- PMID: 11997466
- PMCID: PMC124523
- DOI: 10.1073/pnas.102154799
Genome-wide screening for trait conferring genes using DNA microarrays
Abstract
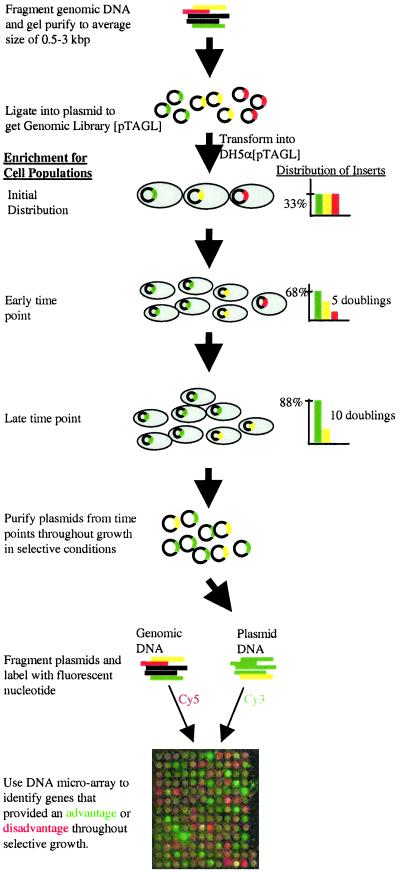
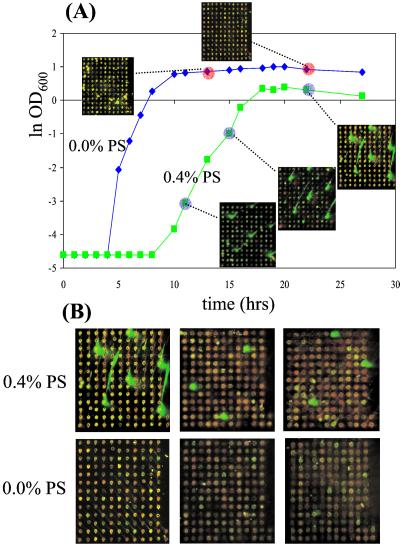
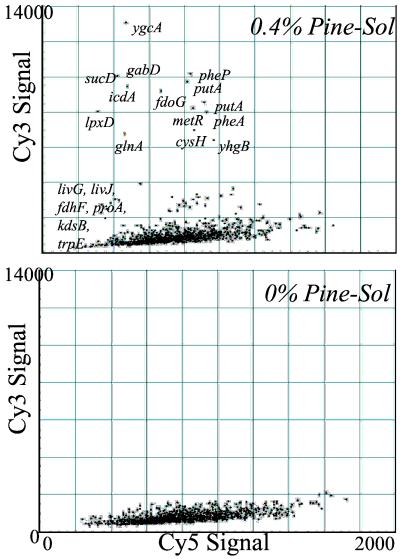
We report a DNA microarray-based method for genome-wide monitoring of competitively grown transformants to identify genes whose overexpression confers a specific cellular phenotype. Whereas transcriptional profiling identifies differentially expressed genes that are correlated with particular aspects of the cellular phenotype, this functional genomics approach determines genes that result in a specific physiology. This parallel gene-trait mapping method consists of transforming a strain with a genomic library, enriching the cell population in transformants containing the trait conferring gene(s), and finally using DNA microarrays to simultaneously isolate and identify the enriched gene inserts. Various methods of enrichment can be used; here, genes conferring low-level antibiotic resistance were identified by growth in selective media. We demonstrated the method by transforming Escherichia coli cells with a genomic E. coli library and selecting for transformants exhibiting a growth advantage in the presence of the anti-microbial agent Pine-Sol. Genes conferring Pine-Sol tolerance (19 genes) or sensitivity (27 genes) were identified by hybridizing, on DNA microarrays containing 1,160 E. coli gene probes, extra-chromosomal DNA isolated from transformed cells grown in the presence of various levels of Pine-Sol. Results were further validated by plating and sequencing of individual colonies, and also by assessing the Pine-Sol resistance of cells transformed with enriched plasmid library or individual resistance genes identified by the microarrays. Applications of this method beyond antibiotic resistance include identification of genes resulting in resistance to chemotherapeutic agents, genes yielding resistance to toxic products (recombinant proteins, chemical feedstocks) in industrial fermentations, genes providing enhanced growth in cell culture or high cell density fermentations, genes facilitating growth on unconventional substrates, and others.
Figures
Similar articles
-
Phenotypic screening of Escherichia coli K-12 Tn5 insertion libraries, using whole-genome oligonucleotide microarrays.Appl Environ Microbiol. 2005 Jan;71(1):451-9. doi: 10.1128/AEM.71.1.451-459.2005. Appl Environ Microbiol. 2005. PMID: 15640221 Free PMC article.
-
Genome-wide localization of mobile elements: experimental, statistical and biological considerations.BMC Genomics. 2005 Jun 1;6:81. doi: 10.1186/1471-2164-6-81. BMC Genomics. 2005. PMID: 15929794 Free PMC article.
-
SCALEs: multiscale analysis of library enrichment.Nat Methods. 2007 Jan;4(1):87-93. doi: 10.1038/nmeth946. Epub 2006 Nov 12. Nat Methods. 2007. PMID: 17099705
-
Screening transposon mutant libraries using full-genome oligonucleotide microarrays.Methods Enzymol. 2007;421:110-25. doi: 10.1016/S0076-6879(06)21011-5. Methods Enzymol. 2007. PMID: 17352919 Review.
-
Applications of DNA microarrays in microbial systems.J Microbiol Methods. 2001 Dec;47(3):257-72. doi: 10.1016/s0167-7012(01)00308-6. J Microbiol Methods. 2001. PMID: 11714516 Review.
Cited by
-
Analysis of genome plasticity in pathogenic and commensal Escherichia coli isolates by use of DNA arrays.J Bacteriol. 2003 Mar;185(6):1831-40. doi: 10.1128/JB.185.6.1831-1840.2003. J Bacteriol. 2003. PMID: 12618447 Free PMC article.
-
Dynamics of genomic-library enrichment and identification of solvent tolerance genes for Clostridium acetobutylicum.Appl Environ Microbiol. 2007 May;73(9):3061-8. doi: 10.1128/AEM.02296-06. Epub 2007 Mar 2. Appl Environ Microbiol. 2007. PMID: 17337545 Free PMC article.
-
Genome-wide identification of genes conferring energy related resistance to a synthetic antimicrobial peptide (Bac8c).PLoS One. 2013;8(1):e55052. doi: 10.1371/journal.pone.0055052. Epub 2013 Jan 31. PLoS One. 2013. PMID: 23383054 Free PMC article.
-
Genome-wide mapping of furfural tolerance genes in Escherichia coli.PLoS One. 2014 Jan 28;9(1):e87540. doi: 10.1371/journal.pone.0087540. eCollection 2014. PLoS One. 2014. PMID: 24489935 Free PMC article.
-
Microevolution from shock to adaptation revealed strategies improving ethanol tolerance and production in Thermoanaerobacter.Biotechnol Biofuels. 2013 Jul 22;6(1):103. doi: 10.1186/1754-6834-6-103. Biotechnol Biofuels. 2013. PMID: 23875846 Free PMC article.
References
-
- Sambrook J, Fritsch E, Maniatis T. Molecular Cloning: A Laboratory Manual. Plainview, NY: Cold Spring Harbor Lab. Press; 1989.
-
- DeRisi J, Iyer V, Brown P. Science. 1997;278:680–685. - PubMed
-
- Roberts C, Nelson B, Marton M, Stoughton R, Meyer M, Bennett H, He Y, Dai H, Walker W, Hughes T, et al. Science. 2000;287:873–880. - PubMed
-
- Schena M, Shalon D, Davis R, Brown P. Science. 1995;270:467–470. - PubMed
-
- Marton M, DeRisi J, Bennett H, Iyer V, Meyer M, Roberts C, Stoughton R, Burchard J, Slade D, Dai H, et al. Nat Med. 1998;4:1293–1301. - PubMed
Publication types
MeSH terms
Grants and funding
LinkOut - more resources
Full Text Sources
Other Literature Sources
