. 2002 Jun;22(11):3707-17.
doi: 10.1128/MCB.22.11.3707-3716.2002.

tRNAs in Trypanosoma brucei: genomic organization, expression, and mitochondrial import

Affiliations

tRNAs in Trypanosoma brucei: genomic organization, expression, and mitochondrial import

Timothy H P Tan et al. Mol Cell Biol. 2002 Jun.

Abstract

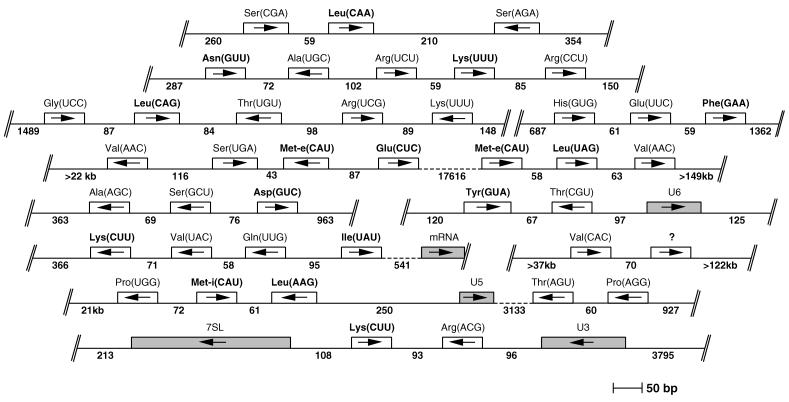
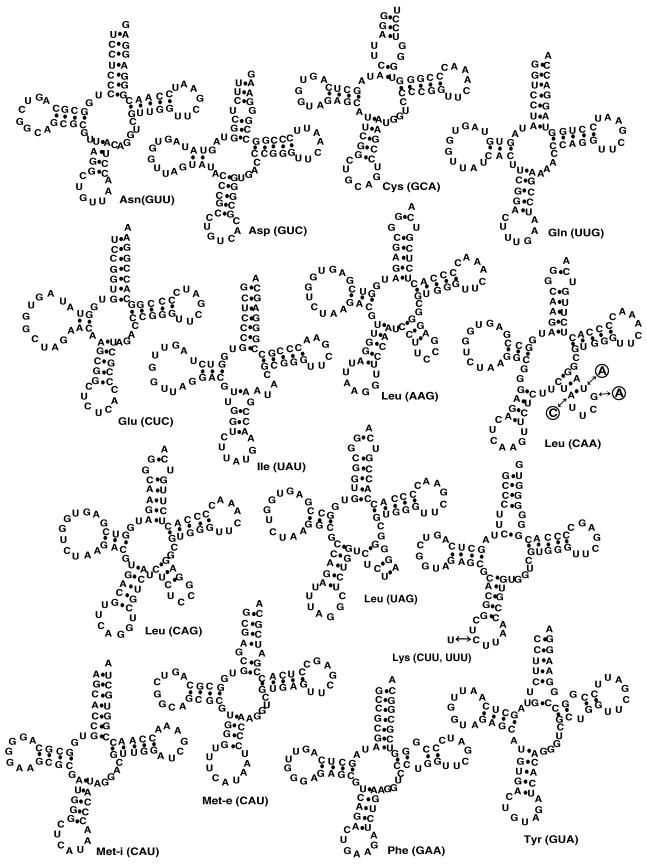
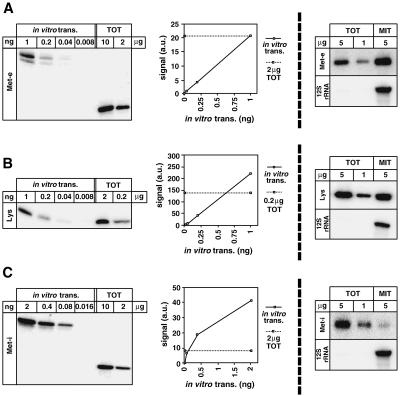
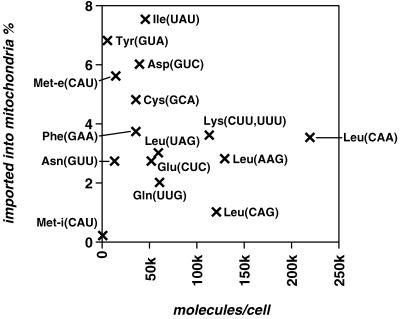
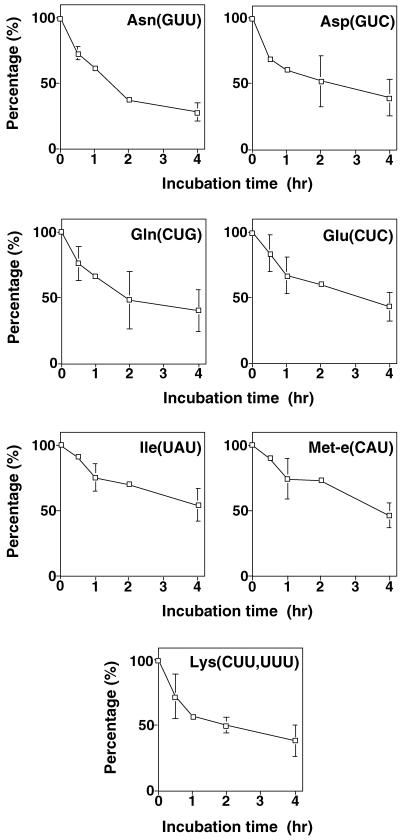
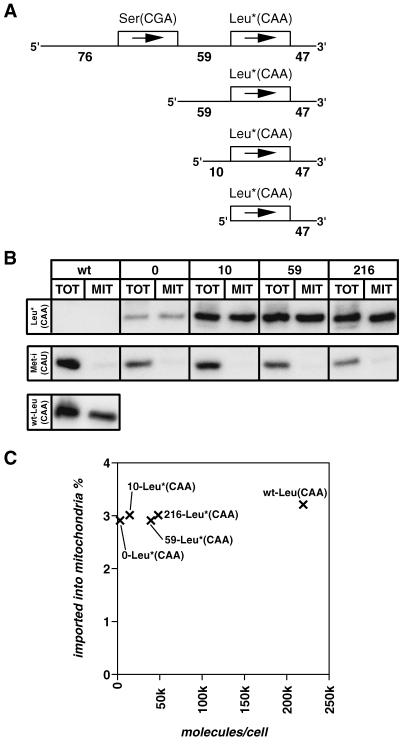
The mitochondrial genome of Trypanosoma brucei does not encode tRNAs. Consequently, all mitochondrial tRNAs are imported from the cytosol and originate from nucleus-encoded genes. Analysis of all currently available T. brucei sequences revealed that its genome carries 50 tRNA genes representing 40 different isoacceptors. The identified set is expected to be nearly complete since all but four codons are accounted for. The number of tRNA genes in T. brucei is very low for a eukaryote and lower than those of many prokaryotes. Using quantitative Northern analysis we have determined the absolute abundance in the cell and the mitochondrion of a group of 15 tRNAs specific for 12 amino acids. Except for the initiator type tRNA(Met), which is cytosol specific, the cytosolic and the mitochondrial sets of tRNAs were qualitatively identical. However, the extent of mitochondrial localization was variable for the different tRNAs, ranging from 1 to 7.5% per cell. Finally, by using transgenic cell lines in combination with quantitative Northern analysis it was shown that import of tRNA(Leu)(CAA) is independent of its 5'-genomic context, suggesting that the in vivo import substrate corresponds to the mature, fully processed tRNA.


Figures

FIG. 1.
FIG. 1.
Genomic organization of T. brucei tRNA genes. The 12 clusters which were identified in the genome of T. brucei and which contain in total 40 tRNA genes are shown and drawn to scale (some of these clusters have been analyzed before [6, 7, 15, 25, 29-31, 45]). The directions of transcription are indicated by arrows, and the predicted anticodons are shown in parentheses. The question mark indicates a tRNA of unknown identity. The numbers indicate the lengths of the known 5′- and 3′-flanking and intergenic sequences. Double slashes denote the ends of each contig. Broken lines represent large intergenic regions. Genes for structural RNAs (U2, U5, U6, 7SL) or mRNAs which are found adjacent to tRNA genes are also shown. The tRNA genes which are found dispersed elsewhere in the genome are not shown. tRNA genes whose gene products have been analyzed in this study are shown in bold.
FIG. 2.
FIG. 2.
Secondary structures of T. brucei tRNAs. Primary sequences and potential secondary structures as predicted by tRNAScan-SE (27) of the 15 tRNA isoacceptors of T. brucei which were used to measure tRNA abundance and mitochondrial localization are shown. Nucleotide substitutions which were introduced into the tRNALeu(CAA) gene of the transgenic cell lines (Fig. 6) are indicated in circles.
FIG. 3.
FIG. 3.
Quantitative Northern analysis. Specific oligonucleotide hybridization was used to detect tRNAMet-e(CAU) (A), tRNALys(CUU, UUU) (B), and tRNAMet-i(CAU) (C). (Left panels) The abundance of tRNAs in total cellular RNA (TOT) was determined by comparison with known quantities of the corresponding in vitro-transcribed tRNA (in vitro trans.). The graphs show the quantification of the blots shown on the right using a phosphorimager. Signal intensities are indicated in arbitrary units (a.u.). (Right panels) Mitochondrial localization was determined by hybridization of the corresponding specific oligonucleotides to known quantities of total and mitochondrial (MIT) RNAs. Lower panels show hybridizations using a probe specific for mitochondrion-encoded rRNA (12S rRNA).
FIG. 4.
FIG. 4.
tRNA abundance in total cell and mitochondria. This is a graphical representation of the results shown in Table 3. The numbers of tRNA molecules per cell were plotted against the percentage of those found in mitochondria. Identities of the tRNAs and their anticodons are indicated. No correlation between expression level and extent of mitochondrial localization was observed (R = −0.29, P = 0.310).
FIG. 5.
FIG. 5.
Intramitochondrial degradation of tRNAs. Isolated mitochondria were incubated at 27°C, and the degradation of the indicated tRNAs was determined by Northern analysis using the same oligonucleotides that were used to determine tRNA abundance. Mean values of two independent experiments are shown. For time points where three or more independent values were available, the standard deviation is indicated.
FIG. 6.
FIG. 6.
In vivo import of tagged tRNALeu(CAA) is independent of its 5′-genomic context. (A) Schematic representation of the inserts of the pHD-437 plasmid-based (3) constructs containing the tagged tRNALeu(CAA) gene (indicated by an asterisk) and the indicated length (0, 10, 59, or 214 nucleotides) of endogenous 5′-flanking region. The three mutations in the variable loop which were introduced as a tag are shown in Fig. 2. (B) Northern blot analysis of wild-type (wt) cells and of cell lines expressing the tagged tRNALeu(CAA) in the context of 0, 10, 59, or 214 nucleotides of their natural 5′-flanking sequence. RNAs isolated from total cells (TOT) (0.5 × 10⁷ cells) and from digitonin-extracted mitochondrial fraction (MIT) (108 cell equivalents) were analyzed. Leu*(CAA), Northern blot probed with an oligonucleotide specifically recognizing the tagged tRNALeu(CAA); Met-i, same blot reprobed with an oligonucleotide specific for the cytosol-specific tRNAMet-i; Leu(CAA), the blot for wild-type cells was reprobed with an oligonucleotide which specifically recognizes the wild-type tRNALeu(CAA). The oligonucleotides used as probes are listed in Table 1. (C) The numbers of tagged tRNALeu(CAA) molecules per cell in the four transgenic cell lines and of the unchanged tRNALeu(CAA) in wild-type cells, as determined by quantitative Northern analysis, were plotted against the percentage of each which is imported into mitochondria.

References

    1. Aphasizhev, R., U. Karmarkar, and L. Simpson. 1998. Are tRNAs imported into mitochondria of kinetoplastid protozoa as 5′-extended precursors? Mol. Biochem. Parasitol. 93:73-80. - PubMed
    1. Béja, O., E. Ullu, and S. Michaeli. 1993. Identification of a tRNA-like molecule that copurifies with the 7SL RNA of Trypanosoma brucei. Mol. Biochem. Parasitol. 57:223-230. - PubMed
    1. Biebinger, S., L. E. Wirtz, P. Lorenz, and C. Clayton. 1996. Vectors for inducible expression of toxic gene products in bloodstream and procyclic Trypanosoma brucei. Mol. Biochem. Parasitol. 85:99-112. - PubMed
    1. Böhringer, S., and H. Hecker. 1975. Quantitative ultrastructural investigations of the life cycle of Trypanosoma brucei: a morphometric analysis. J. Protozool. 22:463-467. - PubMed
    1. Braly, P., L. Simpson, and F. Kretzer. 1974. Isolation of kinetoplast-mitochondrial complexes from Leishmania tarentolae. J. Protozool. 21:782-790. - PubMed

Publication types

MeSH terms