Comparative Study
. 2002 Mar;104(2):133-49.
doi: 10.1023/a:1014656626174.

The Hospital for Sick Children, Toronto, Longitudinal ERG study of children on vigabatrin

Affiliations
Comparative Study

The Hospital for Sick Children, Toronto, Longitudinal ERG study of children on vigabatrin

Carol A Westall et al. Doc Ophthalmol. 2002 Mar.

Abstract

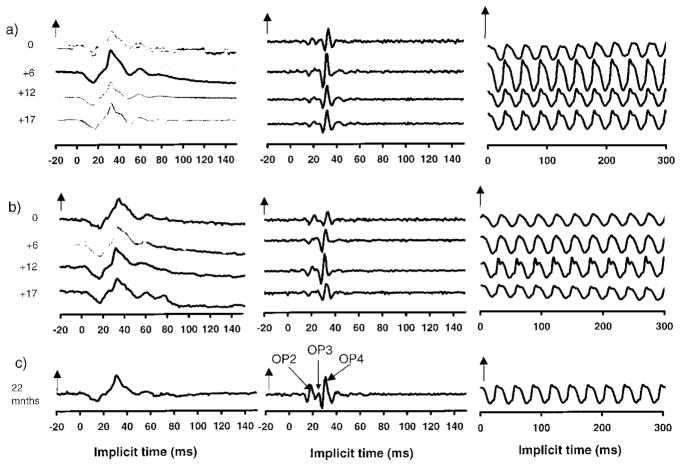
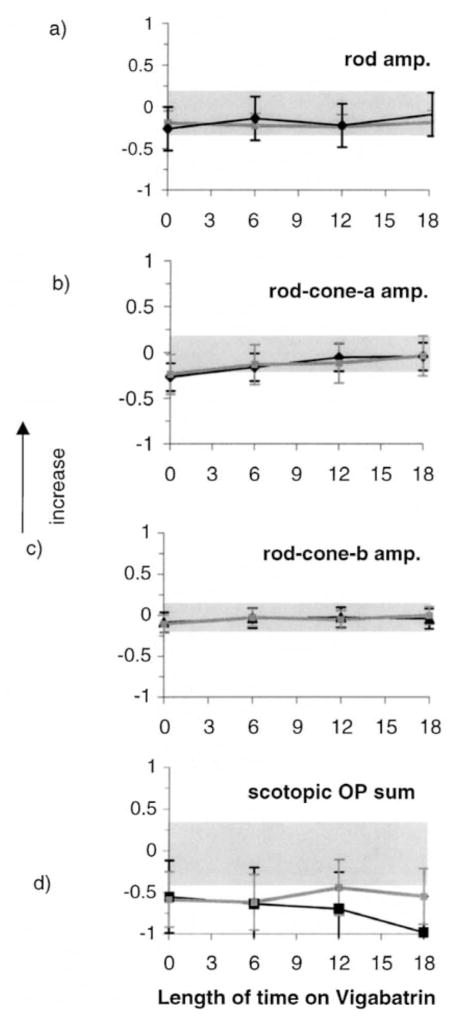
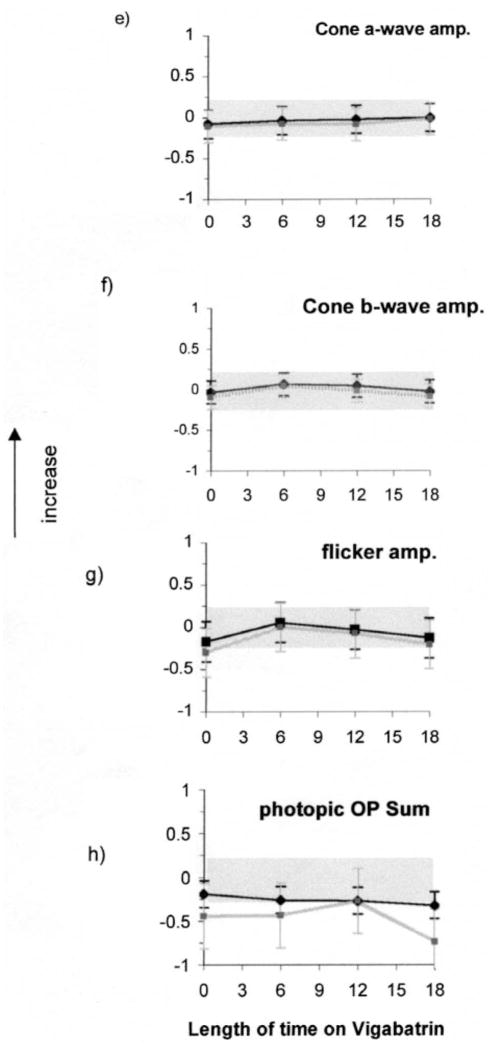
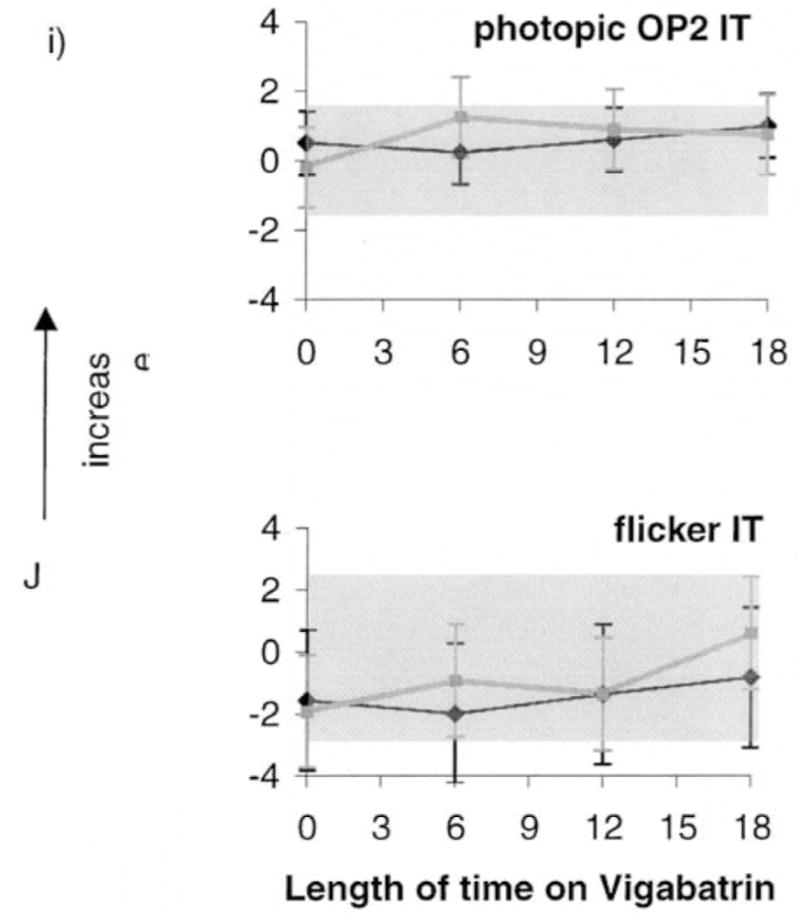
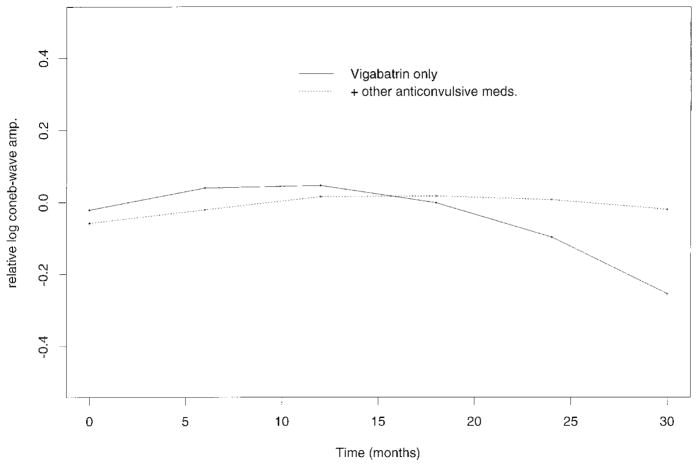
The purpose of this longitudinal study was to identify changes in ERG responses associated with vigabatrin treatment. We accomplished this by recording longitudinally ERGs in children before and during vigabatrin treatment and comparing results between children on vigabatrin monotherapy and those taking additional anticonvulsive medications. Thirty-three children on vigabatrin therapy were tested; the duration between visits was approximately 6 months. Thirteen children were assessed initially before starting vigabatrin therapy and seven were assessed soon after (age range 1.5-126 months, median 6 months). The remaining 13 patients were already on vigabatrin at the time of initial visit (age range 6.5-180 months, median 16 months). ERGs were tested using the standard protocol established by the International Society for Clinical Electrophysiology of Vision, with Burian-Allen bipolar contact-lens electrodes. In addition to standard responses we recorded photopic oscillatory potentials (OPs). All 33 patients were tested longitudinally on at least two occasions and 11 were tested on three occasions. For children whose only anticonvulsive drug was vigabatrin there was a significant curvature (quadratic function, p < 0.05) of the predicted cone b-wave amplitude with time; exhibited as increase in b-wave amplitude followed by subsequent decrease. Descriptive data demonstrated the same pattern in the group taking anticonvulsive medications in addition to vigabatrin. In most children the flicker amplitude declined between 6 months and 1 year of vigabatrin treatment. Our data demonstrated that rod responses, which may be abnormal before initiation of vigabatrin, did not change substantially with vigabatrin treatment.


Figures

Figure 1
Figure 1
Sample ERG traces (average responses) for: (a) subject 1, a 6-month-old child before and at approximately 6 month intervals during vigabatrin treatment; (b) subject 5, a 5-month-old child before and at approximately 6-month intervals during vigabatrin treatment; and (c) a 22-month-old child with normal vision taking no medication. (a), (b) length of time on vigabatrin is shown by the numbers at the left of the series of graphs. ERG implicit time is shown in milliseconds. Positive electrical signals are in the upward direction. Zero points are arbitrarily matched. Left traces are cone responses (two repetitions; vertical arrow represents 100 μV). Middle traces are photopic OPs (vertical arrow represents 20 μV). The definition of OPs 2, 3 and 4 are shown. The right hand traces are flicker responses (vertical arrows represent 100 μV). The stimulus flash is at time 0.
Figure 2
Figure 2
Figures 2a–d. Mean ERG responses from all children in the longitudinal vigabatrin study who received ERGs less than 18 months after initiation of vigabatrin. Log relative amplitudes are plotted against length of time on vigabatrin (months). Black lines represent data on vigabatrin treatment only, gray lines are data from children on vigabatrin treatment and additional anticonvulsive treatment. The error bars represent the standard deviation (mean of four visits). Shaded areas represent lab normal ranges containing 95% of control data. (a) Rod b-wave amplitude; (b) Mixed rod–cone a-wave amplitude; (c) Mixed rode–cone b-wave amplitude; (d) Scotopic sum of OPs. Figures 2e–h. (e) cone a-wave amplitude responses, (f) cone b-wave amplitude responses (g) flicker amplitude data (h) photopic sum of OPs. Figures 2i–j. (i) photopic OP2 implicit time, (j) flicker implicit time from all children in the longitudinal study. Vertical arrows signify that the upward direction reflects increase in both amplitude and implicit time data.
Figure 2
Figure 2
Figures 2a–d. Mean ERG responses from all children in the longitudinal vigabatrin study who received ERGs less than 18 months after initiation of vigabatrin. Log relative amplitudes are plotted against length of time on vigabatrin (months). Black lines represent data on vigabatrin treatment only, gray lines are data from children on vigabatrin treatment and additional anticonvulsive treatment. The error bars represent the standard deviation (mean of four visits). Shaded areas represent lab normal ranges containing 95% of control data. (a) Rod b-wave amplitude; (b) Mixed rod–cone a-wave amplitude; (c) Mixed rode–cone b-wave amplitude; (d) Scotopic sum of OPs. Figures 2e–h. (e) cone a-wave amplitude responses, (f) cone b-wave amplitude responses (g) flicker amplitude data (h) photopic sum of OPs. Figures 2i–j. (i) photopic OP2 implicit time, (j) flicker implicit time from all children in the longitudinal study. Vertical arrows signify that the upward direction reflects increase in both amplitude and implicit time data.
Figure 3
Figure 3
Terms predicted by the most appropriate curve fit; linear or quadratic plots plotted over time for (a) cone b-wave amplitude data, (b) flicker amplitude data and (c) sum of photopic amplitude. Relative amplitudes are plotted against length of time on vigabatrin (months). Predicted curves from the group taking vigabatrin only (solid line) are shown with predicted curves from the group taking vigabatrin and other anticonvulsive medications (broken line).

References

    1. Fois A, Buoni S, Bartolo R, Marco V, Mostardini R. Vigabatrin treatment in children. Child’s Nerv Syst. 1994;10:244–48. - PubMed
    1. Kwong L. Vigabatrin as first line therapy in infantile spasms: review of seven patients. J Paediatr Child Health. 1997;33(2):121–4. - PubMed
    1. Uldall P, Alving J, Gram L, Beck S. Vigabatrin in pediatric epilepsy – an open study. J Child Neurol. 1991;6:2, S38–2S44. - PubMed
    1. Uldall P, Alving J, Gram L, Hogenhaven H. Vigabatrin in childhood epilepsy: a 5-year follow-up study. Neuropediatrics. 1995;26:253–56. - PubMed
    1. Eke T, Talbot JF, Lawden MC. Severe persistent visual field constriction associated with vigabatrin. B Med J. 1997;314:180–181. - PMC - PubMed

Publication types

Grants and funding