. 2002 May;13(5):1778-91.
doi: 10.1091/mbc.01-10-0514.

Targeting of rough endoplasmic reticulum membrane proteins and ribosomes in invertebrate neurons

Affiliations
Free PMC article

Targeting of rough endoplasmic reticulum membrane proteins and ribosomes in invertebrate neurons

Melissa M Rolls et al. Mol Biol Cell. 2002 May.
Free PMC article

Abstract

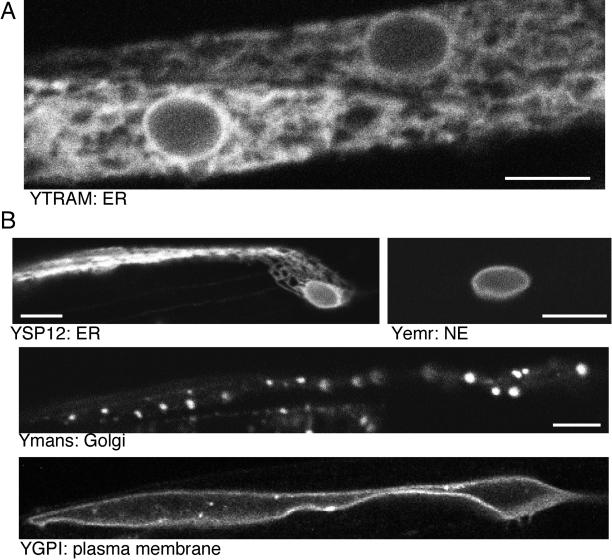
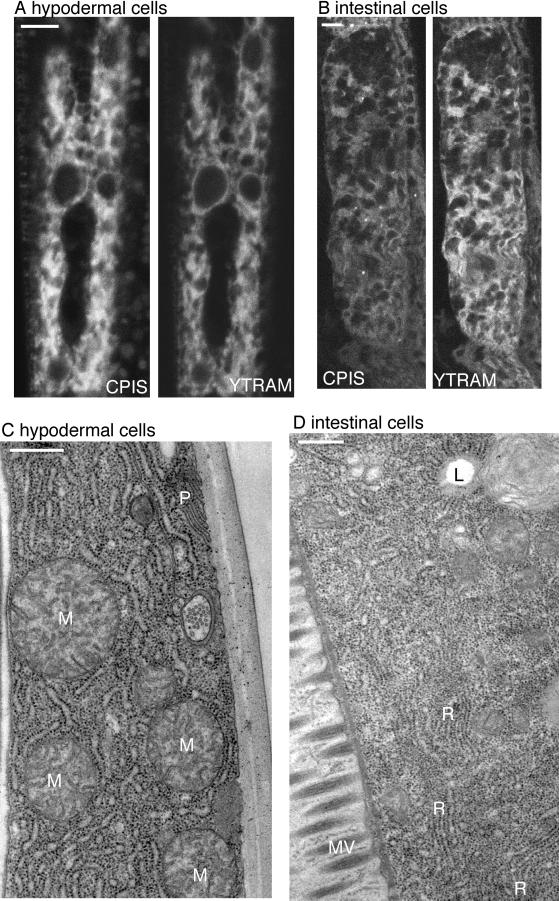
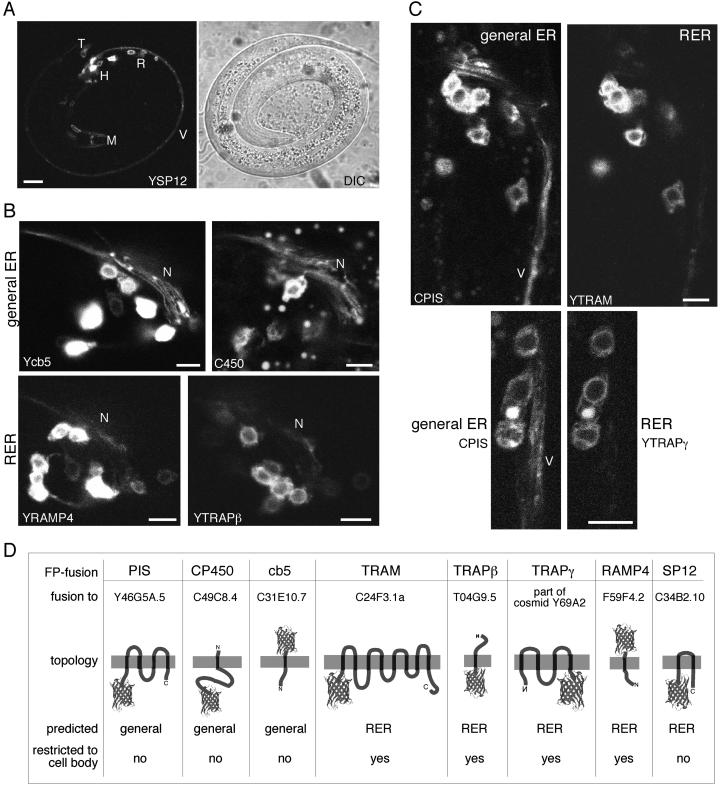
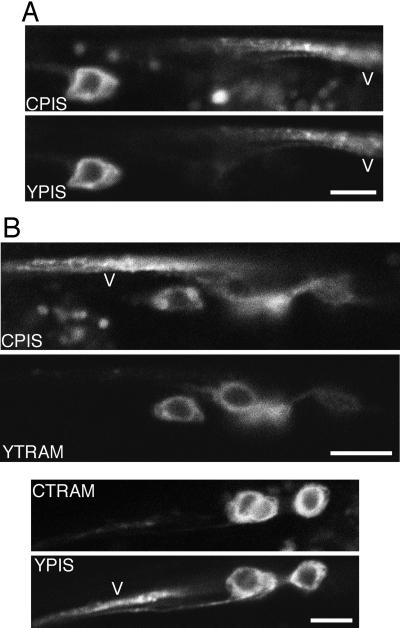
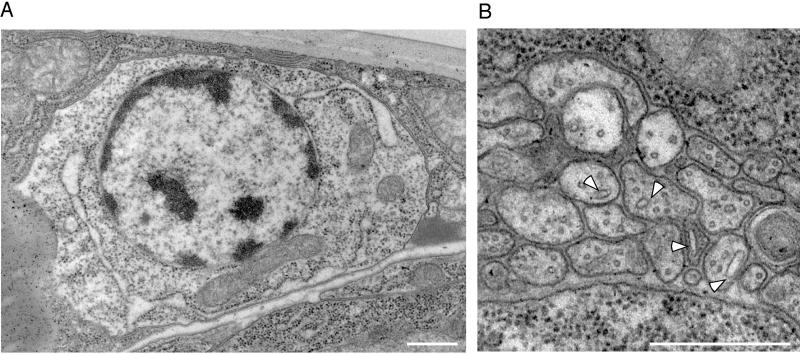
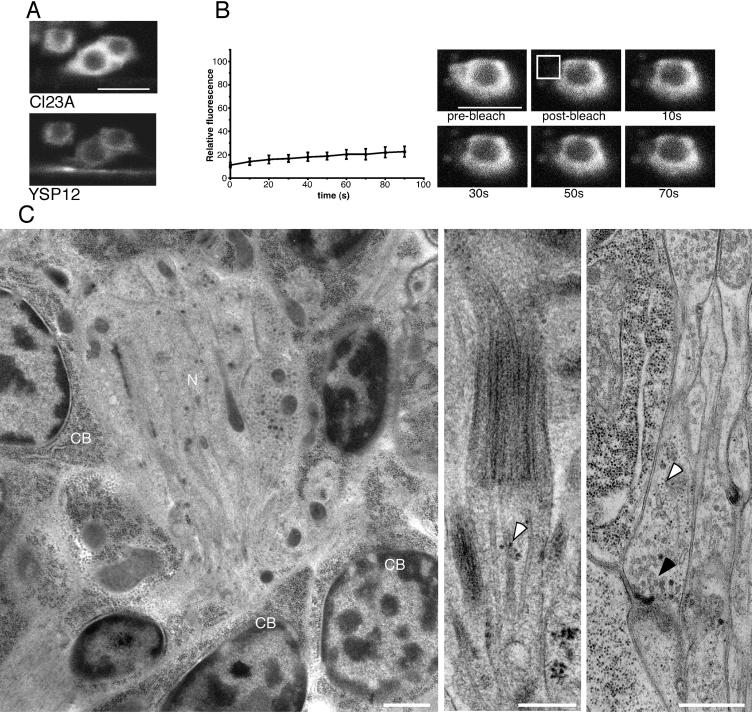
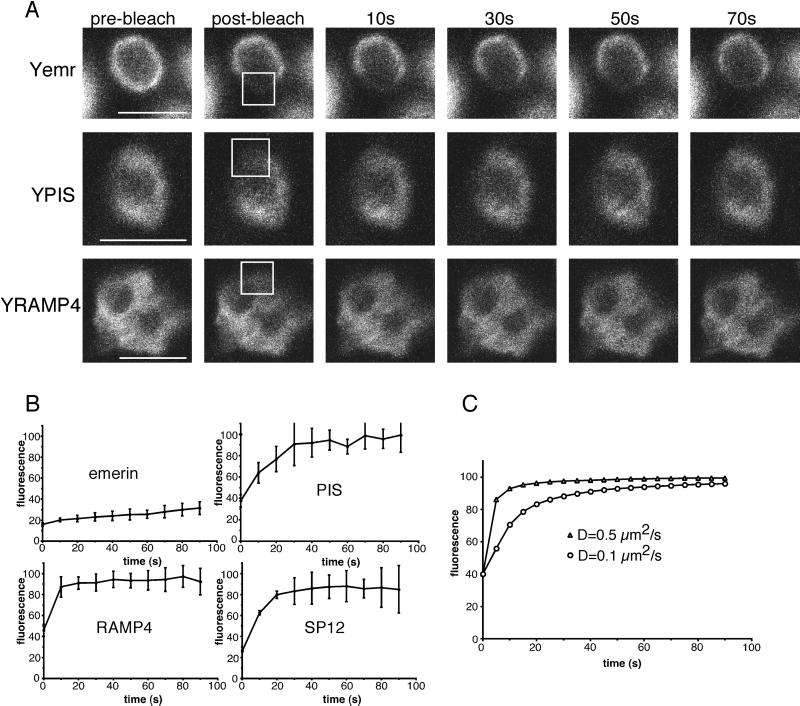
The endoplasmic reticulum (ER) is divided into rough and smooth domains (RER and SER). The two domains share most proteins, but RER is enriched in some membrane proteins by an unknown mechanism. We studied RER protein targeting by expressing fluorescent protein fusions to ER membrane proteins in Caenorhabditis elegans. In several cell types RER and general ER proteins colocalized, but in neurons RER proteins were concentrated in the cell body, whereas general ER proteins were also found in neurites. Surprisingly RER membrane proteins diffused rapidly within the cell body, indicating they are not localized by immobilization. Ribosomes were also concentrated in the cell body, suggesting they may be in part responsible for targeting RER membrane proteins.


Figures

Figure 1
Figure 1
FP fusions to predicted ER membrane proteins can be localized to the ER in C. elegans. (A) YFP-TRAM (YTRAM) was expressed in body wall muscle. A single confocal plane is shown, and the NE and surrounding reticulum are visible. (B) In head muscle markers for different cellular membranes are easily distinguishable. YFP-SP12 (YSPR), YFP-mannosidase transmembrane and stalk (Ymans), YFP-emerin (Yemr), and YGPI were expressed under the control of the glr-1 promoter and imaged in head muscles. In the Ymans and YSP12 panels the nucleus is at the right, and the anterior contractile region of the cell is on the left. Scale bars, 5 μm.
Figure 2
Figure 2
Distribution of ER membrane proteins, and the ER itself, in hypodermal and intestinal cells. (A) CFP-PIS and YFP-TRAM were expressed in hypodermal cells and imaged by confocal microscopy. (B) CFP-PIS (CPIS) and YFP-TRAM (YTRAM) were imaged in intestinal cells by confocal microscopy. Several regions of the cell appear wavy because of movement of the worm during imaging. (C) A transverse section of a worm was examined by electron microscopy after immersion fixation. A portion of a hypodermal cell is shown. The cytoplasm is filled with RER and free ribosomes. M, mitochondria; P, an infolding of the plasma membrane. The hypodermal cell is bounded on the right by cuticle. (D) A portion of an intestinal cell from a transverse section of a worm viewed by electron microscopy and fixed as in C is shown. MV, microvilli in the lumen of the intestine; L, a probable lipid droplet; and R, stacked regions of RER. Scale bars: A and B, 5 μm; C and D, 0.5 μm.
Figure 3
Figure 3
The localization of different ER membrane proteins in neurons is distinct. (A) YFP-SP12 (YSP12) was expressed under control of the glr-1 promoter. Muscle cells in the nose of the worm (M, cells at the tip of the nose on either side) as well as some other head cells express the FP. Fluorescence is also seen in neurons in several head ganglia (H) near the nerve ring, in the retrovesicular ganglion (R), in tail ganglia (T), and in neurites that project along the ventral nerve cord (V). (B) Nerve rings of worms expressing different predicted FP-ER markers were imaged. The predicted general ER markers shown are YFP-cytochrome b5 (Ycb5) and CFP-cytochrome P450 (C450), and predicted RER membrane proteins shown are YFP-RAMP4 (YRAMP4) and YFP-TRAPβ (YTRAPβ). Neurites sweeping across the nerve ring are marked N. (C) CFP-PIS (PIS) was coexpressed with YFP-TRAM (top panel) and YFP-TRAPγ (bottom panel). Neurites in the ventral nerve cord are labeled V. (D) Summary of predicted FP-ER membrane proteins tested. FP fusions were to the full-length genomic region of the gene listed. The FP is represented by the barrel structure. The predicted topologies are shown with the lumen at the top of the diagram. Scale bars are 5 μm, except that in A, which is 10 μm.
Figure 4
Figure 4
Differences in the distribution of ER markers in neurons are independent of the imaging conditions used. (A) CFP-PIS (CPIS) and YFP-PIS (YPIS) were coexpressed under the glr-1 promoter and imaged in a neuron in the retrovesicular ganglion with the ventral nerve cord (V) nearby. (B) In all panels cells in the retrovesicular ganglion were imaged with the ventral nerve cord (V) passing close by. In the top pair of panels CFP-PIS and YFP-TRAM (YTRAM) were imaged in the same cells; in the bottom panels the tags were switched so the TRAM was labeled with CFP and PIS was labeled with YFP. Scale bars, 5 μm.
Figure 5
Figure 5
At the ultrastructural level RER is observed in the cell body of C. elegans neurons, and smooth membranes are present in neurites. (A) The cell body of a neuron in which the ER membranes have become slightly distended during fixation is shown. The distention of the ER makes it clear that the membranes are tightly covered with ribosomes, and highlights the connection of the peripheral ER with the NE. Free ribosomes are also present. (B) A cross section of neurites in the ventral nerve cord is shown. Small regular circles are microtubules. Larger irregular profiles are smooth membranes (arrowheads). Scale bars, 0.5 μm.
Figure 6
Figure 6
Ribosomes are highly concentrated in the cell bodies of neurons. (A) CFP-L23A (CL23A) and YFP-SP12 (YSP12) were coexpressed under control of the glr-1 promoter. Neurons of the retrovesicular ganglion and the nearby ventral nerve cord were imaged. (B) Photobleaching experiments were performed on cell bodies of neurons expressing CFP-L23A. A region of the cell was bleached (boxed area in example at the right), and images were acquired immediately after the bleach and then every 10 s. After background fluorescence was subtracted, the ratio of fluorescence in the bleached and an unbleached area of the cell was calculated (relative fluorescence). The average of six experiments and the 90% confidence interval are plotted on the graph. (C) In the electron micrograph in the left panel ribosomes (electron-dense pepper-like spots) can be seen filling neuronal cell bodies (CB) and are absent from a bundle of neurites (N). In the middle panel the ending of a ciliated sensory neuron in the nose is shown. A cluster of ribosomes near a microtubule is identified by an arrowhead. In the right panel a lengthwise section of part of the ventral nerve cord is shown with adjacent cells at the left of the panel. In the adjacent cells ribosomes appear as very distinct electron dense dots. A few similar dots are present in a presynaptic nerve terminal (white arrowhead). Synaptic vesicles are also present in this nerve terminal (black arrowhead) and below the synaptic vesicles is a dyad synapse onto the neurite below and the muscle cell to the left. A few electron dense dots that are probably ribosomes are also present in the postsynaptic neurite. Scale bars, A and B: 5 μm. Scale bars, C, left and right panels: 0.5 μm; C, middle panel: 0.2 μm.
Figure 7
Figure 7
Concentration of RER membrane markers in the cell body does not require immobilization. (A) Photobleaching experiments were performed as in Figure 6. Bleached regions are indicated with boxes. The examples shown are YFP-emerin (Yemr), YFP-PIS (YPIS), and YFP-RAMP4 (YRAMP4). The bleached region of PIS and RAMP4 is less distinct because they are mobile and proteins move in and out of the region during bleaching. (B) Quantitation of bleaching experiments was performed as in Figure 6, except different numbers of experiments were used for the different proteins. For emerin, six experiments were averaged, for PIS and RAMP4 three experiments, and for SP12 two experiments. (C) Simulations of FRAP in two dimensions were performed using Virtual Cell (http://www.nrcam.uchc.edu/). Diffusion coefficients of 0.5 μm2/s (which is a standard value for membrane proteins in the ER; Nehls et al., 2000) and 0.1 μm2/s were used to model recovery at the center of a 3 × 3-μm2 bleach area. The total computational area was 20 × 20 μm2, and calculations were performed using a 0.4-μm mesh size and a 0.1-s time step. Scale bars, 5 μm.

References

    1. Baumann O, Walz B. Endoplasmic reticulum of animal cells and its organization into structural and functional domains. Int Rev Cytol. 2001;205:149–214. - PubMed
    1. Bergmann JE, Fusco PJ. The G protein of vesicular stomatitis virus has free access into and egress from the smooth endoplasmic reticulum of UT-1 cells. J Cell Biol. 1990;110:625–635. - PMC - PubMed
    1. Cole NB, Smith CL, Sciaky N, Terasaki M, Edidin M, Lippincott-Schwartz J. Diffusional mobility of Golgi proteins in membranes of living cells. Science. 1996;273:797–801. - PubMed
    1. Cowan AE, Nakhimovsky L, Myles DG, Koppel DE. Barriers to diffusion of plasma membrane proteins form early during guinea pig spermiogenesis. Biophys J. 1997;73:507–516. - PMC - PubMed
    1. Dayel MJ, Hom EF, Verkman AS. Diffusion of green fluorescent protein in the aqueous-phase lumen of the endoplasmic reticulum. Biophys J. 1999;76:2843–2851. - PMC - PubMed

Publication types

MeSH terms

LinkOut - more resources