

Differences in innate immune responses (in vitro) to HeLa cells infected with nondisseminating serovar E and disseminating serovar L2 of Chlamydia trachomatis
- PMID: 12011019
- PMCID: PMC128021
- DOI: 10.1128/IAI.70.6.3234-3248.2002
Differences in innate immune responses (in vitro) to HeLa cells infected with nondisseminating serovar E and disseminating serovar L2 of Chlamydia trachomatis
Abstract
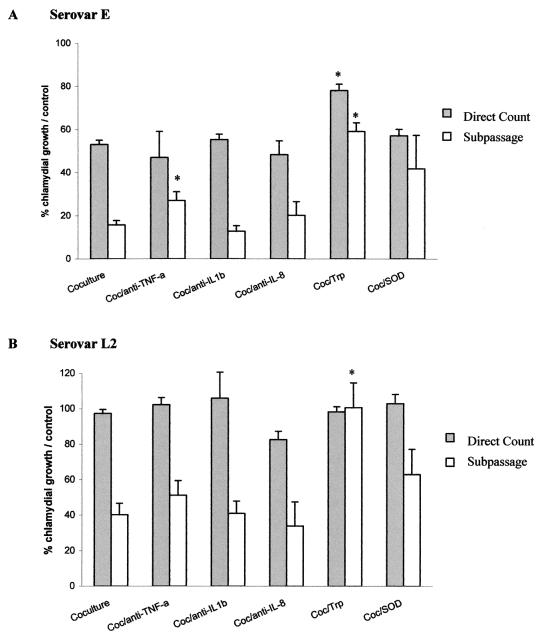
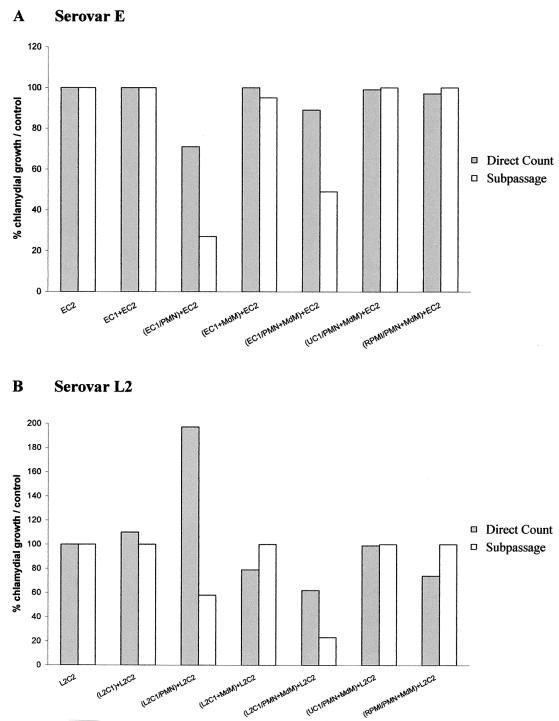
The inflammatory response associated with Chlamydia trachomatis genital infections is thought to be initiated by the release of proinflammatory cytokines from infected epithelial cells. This study focuses on the interactions between C. trachomatis-infected HeLa cells and immune cells involved in the early stages of infection, i.e., neutrophils and macrophages. First, we showed that the expression of interleukin-11 (IL-11), an anti-inflammatory cytokine mainly active on macrophages, was upregulated at the mRNA level in the genital tracts of infected mice. Second, incubation of differentiated THP-1 (dTHP-1) cells or monocyte-derived macrophages (MdM) with basal culture supernatants from C. trachomatis serovar E- or serovar L2-infected HeLa cells resulted in macrophage activation with a differential release of tumor necrosis factor alpha (TNF-alpha) and upregulation of indoleamine 2,3-deoxygenase (IDO) but not of Toll-like receptor 2 and 4 mRNA expression. Third, coculture of infected HeLa cells with dTHP-1 cells resulted in a reduction in chlamydial growth, which was more dramatic for serovar E than for L2 and which was partially reversed by the addition of anti-TNF-alpha antibodies for serovar E or exogenous tryptophan for both serovars but was not reversed by the addition of superoxide dismutase or anti-IL-8 or anti-IL-1beta antibodies. A gamma interferon-independent IDO mRNA upregulation was also detected in dTHP-1 cells from infected cocultures. Lastly, with a two-stage coculture system, we found that (i) supernatants from neutrophils added to the apical side of infected HeLa cell cultures were chlamydicidal and induced MdM to express antichlamydial activity and (ii) although polymorphonuclear leukocytes released more proinflammatory cytokines in response to serovar E- than in response to L2-infected cells, MdM were strongly activated by serovar L2 infection, indicating that the early inflammatory response generated with a nondisseminating or a disseminating strain is different.
Figures


Similar articles
-
Chlamydial infection of polarized HeLa cells induces PMN chemotaxis but the cytokine profile varies between disseminating and non-disseminating strains.Cell Microbiol. 2000 Aug;2(4):317-27. doi: 10.1046/j.1462-5822.2000.00058.x. Cell Microbiol. 2000. PMID: 11207588
-
Sustained interleukin-6 and interleukin-8 expression following infection with Chlamydia trachomatis serovar L2 in a HeLa/THP-1 cell co-culture model.Scand J Immunol. 2006 Mar;63(3):199-207. doi: 10.1111/j.1365-3083.2006.01734.x. Scand J Immunol. 2006. PMID: 16499573
-
Toll-like receptor-2, but not Toll-like receptor-4, is essential for development of oviduct pathology in chlamydial genital tract infection.J Immunol. 2003 Dec 1;171(11):6187-97. doi: 10.4049/jimmunol.171.11.6187. J Immunol. 2003. PMID: 14634135
-
Implications for persistent chlamydial infections of phagocyte-microorganism interplay.Eur J Clin Microbiol Infect Dis. 1991 Feb;10(2):119-23. doi: 10.1007/BF01964423. Eur J Clin Microbiol Infect Dis. 1991. PMID: 1907541 Review.
-
Influence of the tryptophan-indole-IFNγ axis on human genital Chlamydia trachomatis infection: role of vaginal co-infections.Front Cell Infect Microbiol. 2014 Jun 3;4:72. doi: 10.3389/fcimb.2014.00072. eCollection 2014. Front Cell Infect Microbiol. 2014. PMID: 24918090 Free PMC article. Review.
Cited by
-
Suppressors of Cytokine Signaling (SOCS)1 and SOCS3 Proteins Are Mediators of Interleukin-10 Modulation of Inflammatory Responses Induced by Chlamydia muridarum and Its Major Outer Membrane Protein (MOMP) in Mouse J774 Macrophages.Mediators Inflamm. 2020 Jun 24;2020:7461742. doi: 10.1155/2020/7461742. eCollection 2020. Mediators Inflamm. 2020. PMID: 32684836 Free PMC article.
-
The use of serological titres of IgA and IgG in (early) discrimination between rectal infection with non-lymphogranuloma venereum and lymphogranuloma venereum serovars of Chlamydia trachomatis.Sex Transm Infect. 2007 Jul;83(4):330-4. doi: 10.1136/sti.2006.024372. Epub 2007 May 2. Sex Transm Infect. 2007. PMID: 17475689 Free PMC article.
-
Murine oviduct epithelial cell cytokine responses to Chlamydia muridarum infection include interleukin-12-p70 secretion.Infect Immun. 2004 Jul;72(7):3951-60. doi: 10.1128/IAI.72.7.3951-3960.2004. Infect Immun. 2004. PMID: 15213139 Free PMC article.
-
Seminal Fluid-Mediated Inflammation in Physiology and Pathology of the Female Reproductive Tract.J Immunol Res. 2016;2016:9707252. doi: 10.1155/2016/9707252. Epub 2016 Jul 3. J Immunol Res. 2016. PMID: 27446968 Free PMC article. Review.
-
Differences in Chlamydia trachomatis serovar E growth rate in polarized endometrial and endocervical epithelial cells grown in three-dimensional culture.Infect Immun. 2007 Feb;75(2):553-64. doi: 10.1128/IAI.01517-06. Epub 2006 Nov 6. Infect Immun. 2007. PMID: 17088348 Free PMC article.
References
-
- Airenne, S., H. M. Surcel, A. Bloigu, K. Laitinen, P. Saikku, and A. Laurila. 2000. The resistance of human monocyte-derived macrophages to Chlamydia pneumoniae infection is enhanced by interferon-gamma. APMIS 108:139-144. - PubMed
-
- Bozza, M., J. L. Bliss, A. J. Dorner, and W. L. Trepicchio. 2001. Interleukin-11 modulates Th1/Th2 cytokine production from activated CD4+ T cells. J. Interferon Cytokine Res. 21:21-30. - PubMed
-
- Campbell, S., S. J. Richmond, P. S. Yates, and C. C. Storey. 1994. Lipopolysaccharide in cells infected by Chlamydia trachomatis. Microbiology 140:1995-2002. - PubMed
-
- Cario, E., I. M. Rosenberg, S. L. Brandwein, P. L. Beck, H.-C. Reinecker, and D. K. Podolsky. 2000. Lipopolysaccharide activates distinct signaling pathways in intestinal epithelial cell lines expressing Toll-like receptors. J. Immunol. 164:966-972. - PubMed
-
- Currier, A. R., M. H. Ziegler, M. M. Riley, T. A. Babcock, V. P. Telbis, and J. M. Carlin. 2000. Tumor necrosis factor-α and lipopolysaccharide enhance interferon-induced antichlamydial indoleamine dioxygenase activity independently. J. Interferon Cytokine Res. 20:369-376. - PubMed
Publication types
MeSH terms
Substances
Grants and funding
LinkOut - more resources
Full Text Sources
Medical
Research Materials
