. 2002 May;129(1):374-88.
doi: 10.1104/pp.001164.

The biophysics of leaf growth in salt-stressed barley. A study at the cell level

Affiliations

The biophysics of leaf growth in salt-stressed barley. A study at the cell level

Wieland Fricke et al. Plant Physiol. 2002 May.

Abstract

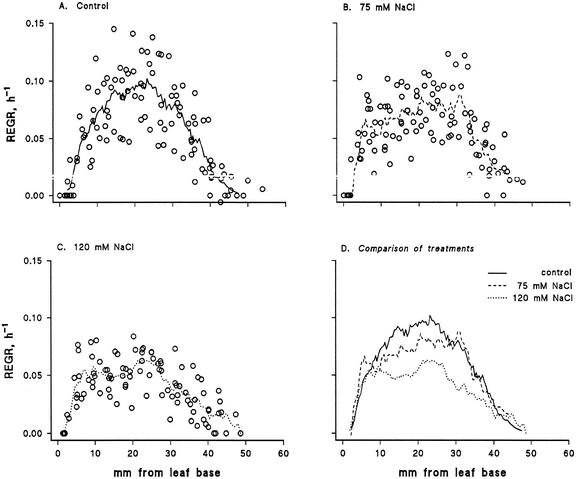
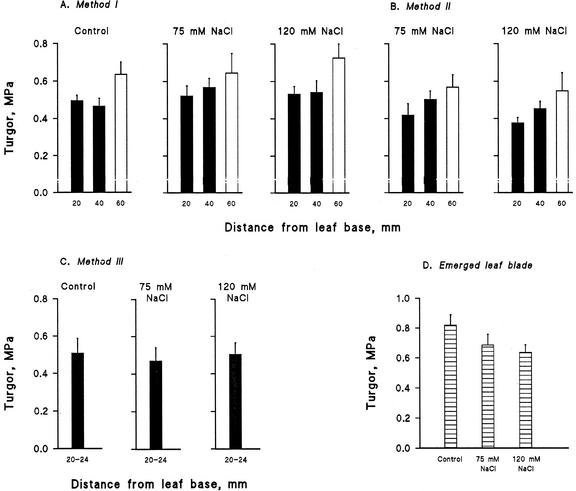
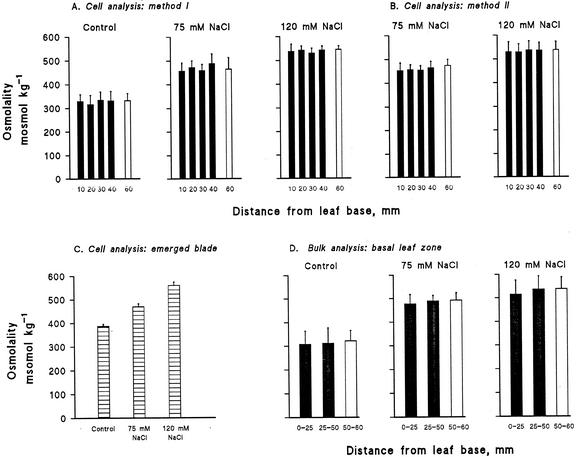
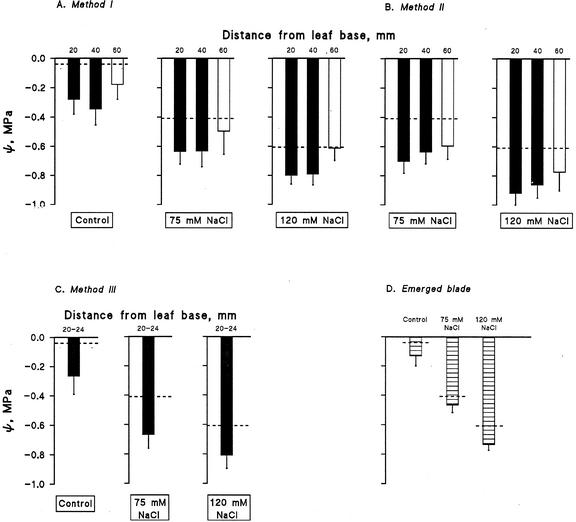
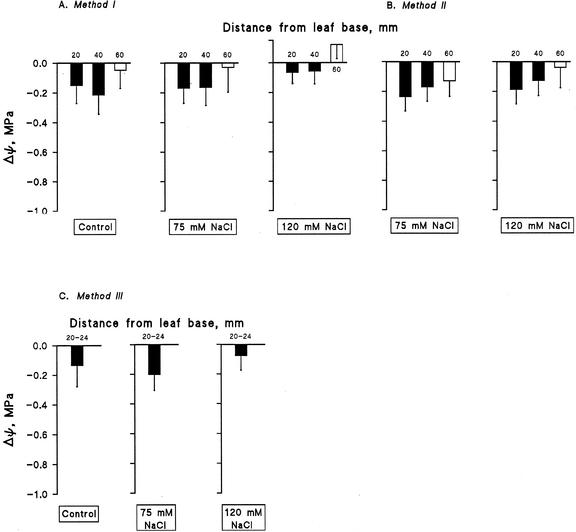
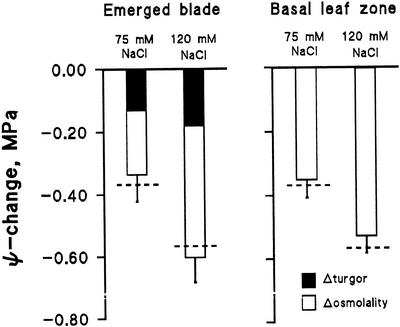
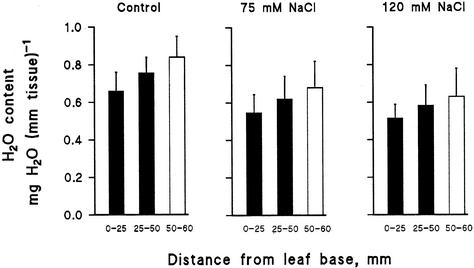
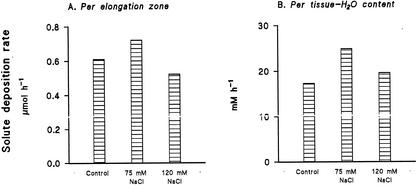
Biophysical parameters potentially involved in growth regulation were studied at the single-cell level in the third leaf of barley (Hordeum vulgare) after exposure to various degrees of NaCl stress for 3 to 5 d. Gradients of elongation growth were measured, and turgor pressure, osmolality, and water potentials (psi) were determined (pressure probe and picoliter osmometry) in epidermal cells of the elongation zone and the mature blade. Cells in the elongation zone adjusted to decreasing external psi through increases in cell osmolality that were accomplished by increased solute loads and reduced water contents. Cell turgor changed only slightly. In contrast, decreases in turgor also contributed significantly to psi adjustment in the mature blade. Solute deposition rates in the elongation zone increased at moderate stress levels as compared with control conditions, but decreased again at more severe NaCl exposure. Growth-associated psi gradients between expanding epidermal cells and the xylem were significant under control and moderate stress conditions (75 mM NaCl) but seemed negligible at severe stress (120 mM NaCl). We conclude that leaf cell elongation in NaCl-treated barley is probably limited by the rate at which solutes can be taken up to generate turgor, particularly at high NaCl levels.


Figures

Figure 1
Figure 1
Profiles of REGR along the basal region of leaf three of barley grown under control conditions (A) or grown on nutrient solution containing 75 mm (B) or 120 mm NaCl (C). In A, B, and C, original data from pin-prick experiments performed in 10 to 11 individual plants are given together with a curve showing the running mean of nine consecutive data points. For comparison, D shows curves without original data.
Figure 2
Figure 2
Epidermal cell turgor pressure along the basal region (A–C) and in the emerged part (D) of leaf three of barley grown under control conditions or on nutrient solution containing 75 or 120 mm NaCl as indicated. The base of the third leaf was made accessible by one of three preparation methods (A, B, and C, respectively; for methodical details see “Materials and Methods”). Turgor values measured in basal region cells that were actively growing are given as black bars, whereas values from cells that had ceased to elongate are symbolized by white bars (in A–C; compare with Fig. 1). Mature cells (D; hatched bars) had emerged from the older leaf sheaths more than 1 d before the experiment. Turgor was measured with the cell-pressure probe in five to six plants of each treatment, with three to six cells measured at each location. Values given are means ± sd. NaCl-treated plants in A and B showed at various positions statistically significant (P < 0.05 in Student's t test) differences in turgor as compared with turgor values in control plants (A, at 40 mm for 75 mm NaCl, and at all positions for 120 mm NaCl; B, at 20 mm for 75 mm and for 120 mm NaCl). Along the leaf region enclosed by older sheaths, turgor was always significantly higher outside of the elongation zone (white bars in A ands B) than within it (black bars in A and B). In the emerged blade (D), cell turgor was significantly higher in the control than in the NaCl-treated plants; the difference between NaCl treatments was not significant in D.
Figure 3
Figure 3
Osmolality in epidermal cells (A–C) and bulk-leaf extracts (D) of the third leaf of barley grown under control conditions or grown on nutrient solution containing 75 or 120 mm NaCl as indicated. Cell osmolality was determined by picoliter osmometry of cell sap extracted at five different locations along the basal leaf region (A and B) or halfway along the emerged part of the blade (C). Cells of the basal region were made accessible by either of two methods (A and B; see “Materials and Methods” for full details). Data obtained from cells located within the elongation zone are marked by black bars, whereas data from cells that had ceased to elongate are given by white bars. In the emerged part of the leaf (hatched bars), cells were fully mature and had been exposed to the atmosphere for more than 1 d. Results are means ± sd of five to seven leaf analyses.
Figure 4
Figure 4
ψ of epidermal cells along the basal region (A–C) and the emerged part (D) of leaf three of barley grown under control conditions, or grown on nutrient solution containing 75 or 120 mm NaCl as indicated. Growth media ψ are given as dashed lines. ψ of cells were calculated from cell turgor (see Fig. 2) and cell osmolality (see Fig. 3). Data obtained from cells located within the elongation zone are marked by black bars, whereas data from cells that had ceased to elongate are given by white bars. In the emerged part of the leaf (hatched bars), cells were fully mature and had been exposed to the atmosphere for more than 1 d.
Figure 5
Figure 5
ψ gradients (Δψ) along the basal region of leaf three of barley grown under control conditions, or grown on nutrient solution containing 75 or 120 mm NaCl as indicated. ψ gradients between epidermal cells and leaf xylem were determined using the smallest possible estimates of xylem ψ (see text for details). Values for tissue located within the elongation zone are shown as black bars; values for tissue outside of the elongation zone are given as white bars.
Figure 6
Figure 6
Contribution of changes in turgor and changes in osmolality to the adjustment of epidermal cell ψ in response to changes in root medium ψ. Adjustment was studied in the emerged part and in the basal region of leaf three. Changes in cell ψ are given relative to the situation in control experiments, where the nutrient medium ψ was −0.4 MPa. Stressed plants were grown on media containing 75 or 120 mm NaCl (as indicated); the corresponding decrease in external ψ is indicated by dashed lines. To simplify presentation of data for the basal leaf region, values obtained at 20, 40, and 60 mm from the leaf base were pooled (compare Figs. 2–4) and averaged. The contribution of turgor changes to ψ adjustment along the basal leaf zone was negligible (<1%) and does not show in the graph.
Figure 7
Figure 7
Water content per unit of leaf length along the basal region of leaf three of barley grown under control conditions, or grown on nutrient solution containing 75 or 120 mm NaCl as indicated. Black bars represent data from tissue located within the elongation zone (compare Fig. 1). The continuing increase of water content beyond the elongation zone indicates substantial leaf growth in width and/or diameter in the absence of tissue elongation. Means ± sd of 12 leaves analyzed are shown.
Figure 8
Figure 8
Deposition rates of solutes along the elongation zone of leaf three of barley grown under control conditions or grown on nutrient solution containing 75 or 120 mm NaCl as indicated. Deposition rates are expressed either as the amount of solutes deposited per elongation zone and hour (A) or as the amount of solutes deposited per water content of the elongation zone and hour (B).

References

    1. Acevedo E, Hsiao TC, Henderson DW. Immediate and subsequent growth responses of maize leaves to changes in water status. Plant Physiol. 1971;48:631–636. - PMC - PubMed
    1. Arif H, Tomos AD. Control of wheat leaf growth under saline conditions. In: Lieth H, Al Masoom A, editors. Towards the Rational Use of High Salinity Tolerant Plants. Vol. 2. Dordrecht, The Netherlands: Kluwer Academic Publishers; 1993. pp. 45–52.
    1. Barlow EWR. Water relations of expanding leaves. Aust J Plant Physiol. 1986;13:45–58.
    1. Bernstein N, Läuchli A, Silk WK. Kinematics and dynamics of sorghum (Sorghum bicolor L.) leaf development at various Na/Ca salinities. Plant Physiol. 1993;103:1107–1114. - PMC - PubMed
    1. Boyer JS. Water transport in plants: mechanisms of apparent changes in resistance during absorption. Planta. 1974;117:187–207. - PubMed

Publication types

MeSH terms

LinkOut - more resources