. 2002 May 14;99(10):6707-12.
doi: 10.1073/pnas.082114199.

CLOUDS, a protocol for deriving a molecular proton density via NMR

Affiliations
Free PMC article

CLOUDS, a protocol for deriving a molecular proton density via NMR

Alexander Grishaev et al. Proc Natl Acad Sci U S A. .
Free PMC article

Erratum in

  • Proc Natl Acad Sci U S A 2002 Aug 6;99(16):10941

Abstract

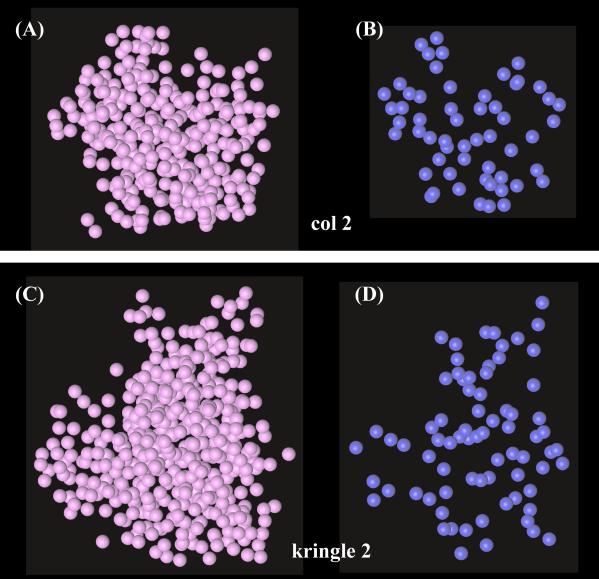
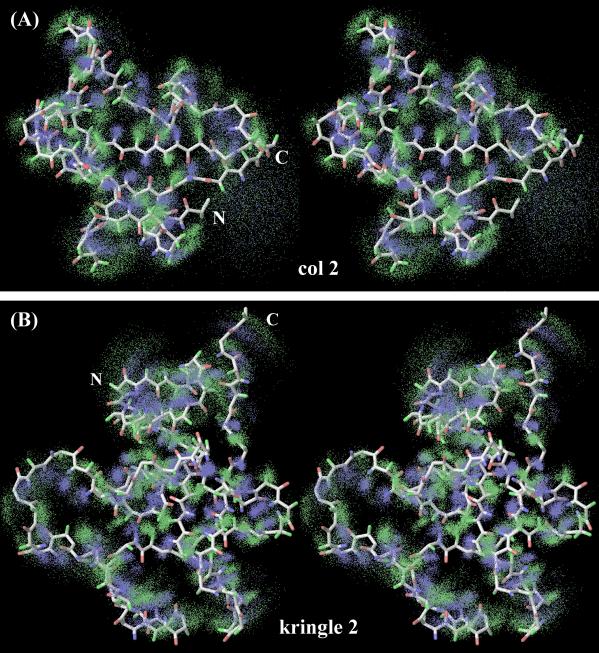
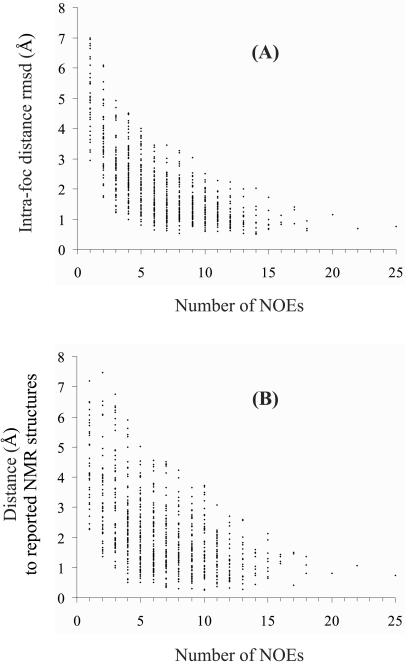
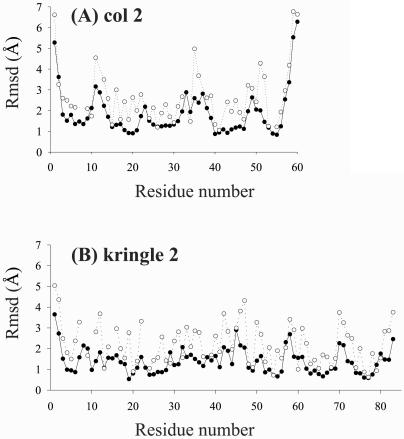
We demonstrate the feasibility of computing realistic spatial proton distributions for proteins in solution from experimental NMR nuclear Overhauser effect data only and with minimal assignments. The method, CLOUDS, relies on precise and abundant interproton distance restraints calculated via a relaxation matrix analysis of sets of experimental nuclear Overhauser effect spectroscopy crosspeaks. The MIDGE protocol was adapted for this purpose. A gas of unassigned, unconnected H atoms is condensed into a structured proton distribution (cloud) via a molecular dynamics simulated-annealing scheme in which the internuclear distances and van der Waals repulsive terms are the only active restraints. Proton densities are generated by combining a large number of such clouds, each computed from a different trajectory. After filtering by reference to the cloud closest to the mean, a minimal dispersion proton density (foc) is identified. The latter affords a quasi-continuous hydrogen-only probability distribution that conveys immediate information on the protein surface topology (grooves, protrusions, potential binding site cavities, etc.), directly related to the molecular structure. Feasibility of the method was tested on NMR data measured on two globular protein domains of low regular secondary structure content, the col 2 domain of human matrix metalloproteinase-2 and the kringle 2 domain of human plasminogen, of 60 and 83 amino acid residues, respectively.


Figures

Figure 1
Figure 1
MIDGE flowchart. A, the experimental (input) NOESY matrix; Ad, the diagonal submatrix of A; I, the unit matrix. A1, R1, A2, R2, Δ1, Δ2, Λ1, and Λ2 are defined in the flowchart. X1 and X2 represent the matrices of A1 and R2 eigenvectors, respectively, α is an adjustable convergence parameter, and D is the interproton distance matrix (output). The correction fi, as well as γn and ΔRn are defined in the text (Eqs. 3–5). Matrices are in bold or enclosed in square brackets.
Figure 2
Figure 2
Deviations of the cloud ensemble by reference to individual clouds: col 2 (A) and kringle 2 (B). Each cloud is selected as “pivot” for cloud alignment. The dispersion of backbone HN and Hα coordinates relative to the mean is gauged by the average rmsd, 〈rmsd〉, plotted against pivot number. For each cloud, HN atoms were constrained by both NOEs and HN/HN ADCs; HN/Hα ADCs were incorporated for kringle 2 (see Table 1).
Figure 3
Figure 3
Individual clouds for col 2 (A and B) and kringle 2 (C and D). All H atoms are included in A and C; HN atoms only are shown in B and D. The illustrated clouds are those closest to the average (minimal 〈rmsd〉; see Fig. 2).
Figure 4
Figure 4
Stereo views of molecular focs (backbone H atoms only). (A) col 2; (B) kringle 2. HN and Hα atoms are shown in blue and green, respectively. The illustrated focs are all-cloud overlaps by reference to the cloud closest to the average (see Fig. 3).
Figure 5
Figure 5
Precision (A) and accuracy (B) of atomic locations for all foc H atoms versus the number of NOE restraints for each H atom. (A) Atomic distance rmsds relative to the foc average. (B) Individual atom distances from their foc means to their means in reported NMR structures (9, 10). The histograms combine col 2 and kringle 2 data, one point per each of 766 atoms.
Figure 6
Figure 6
Precision of focs along the backbone. (A) col 2. (B) kringle 2. Rmsd values are relative to foc averages. ●, backbone hydrogens (averaged HN and Hα); ○, side chain hydrogens (averaged).
Figure 7
Figure 7
Col 2 Trp-40: aromatic ring foc. (A) Front view. (B) Edge side view with Hɛ1 in front. The nitrogen-bound Hδ1 is shown in blue. The atomic focs are depicted after filtering, by which 25% of the points farthest removed from each updated atomic center of mass were successively discarded.

References

    1. Boelens R, Koning T M G, Van Der Marel G A, Van Boom J H, Kaptein R. J Magn Reson. 1989;82:290–308.
    1. Borgias B A, James T L. J Magn Reson. 1990;87:475–487.
    1. Zhang Q, Chen J Y, Gozansky E K, Zhu F, Jackson P L, Gorenstein D G. J Magn Reson B. 1995;106:164–169. - PubMed
    1. Madrid M, Llinás E, Llinás M. J Magn Reson. 1991;93:329–346.
    1. Wüthrich K. NMR of Proteins and Nucleic Acids. New York: Wiley; 1986. pp. 117–199.

Publication types