. 2002 May 14;99(10):6848-53.
doi: 10.1073/pnas.092136399.

The root of the angiosperms revisited

Affiliations

The root of the angiosperms revisited

Michael J Zanis et al. Proc Natl Acad Sci U S A. .

Abstract

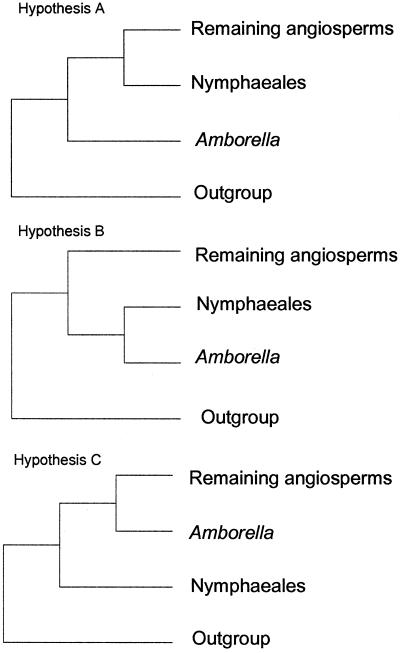
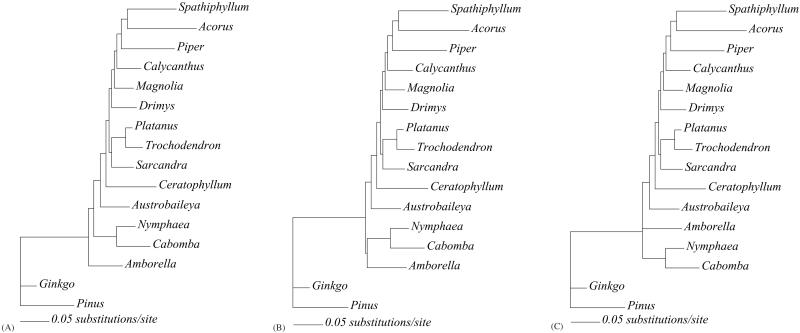
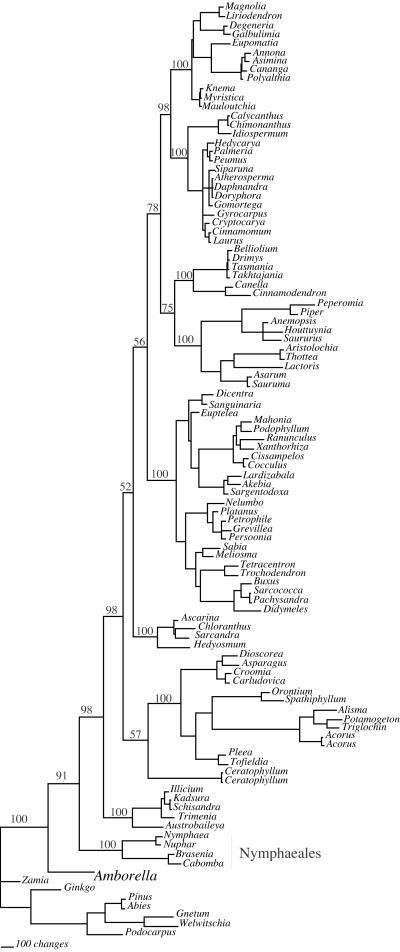
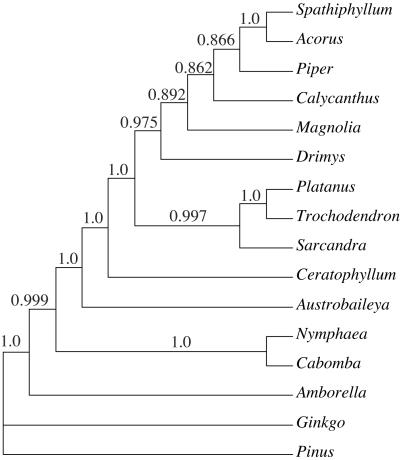
Most recent phylogenetic analyses of basal angiosperms have converged on the placement of Amborella as sister to all other extant angiosperms. However, certain recent studies suggest that Amborella and Nymphaeales (water lilies) form a clade sister to all remaining angiosperms or that Nymphaeales alone are the sister to the remaining angiosperms. We report here (i) maximum parsimony, maximum likelihood, and Bayesian phylogenetic analyses of 11 genes (>15,000 bp per taxon) for 16 taxa, (ii) maximum parsimony analysis for a subset of these genes for 104 taxa, and (iii) tests of alternative rootings with the nonparametric bootstrap and the likelihood ratio test with the parametric bootstrap. In addition, we use simulation analyses to examine the amount of bias that may be present in our methods of phylogeny estimation. Amborella continues to receive strong bootstrap support as the sister to all other extant angiosperms, and three of four tests reject alternative hypotheses of the angiosperm root. Although we cannot conclusively choose between Amborella vs. Amborella + Nymphaeales as sister to all other angiosperms, most analyses favor the former rooting.


Figures

Figure 1
Figure 1
The three phylogenetic hypotheses regarding the placement of the root of the angiosperms. (Hypothesis A) Amborella is sister to all other extant angiosperms. (Hypothesis B) Amborella + Nymphaeales are sister to all remaining angiosperms. (Hypothesis C) Nymphaeales are sister to all remaining angiosperms.
Figure 2
Figure 2
Trees showing branch lengths for each of the three hypotheses. Branch lengths estimated with ML assuming an HKY + Γ model of sequence evolution with the total-evidence data set for the three phylogenetic hypotheses outlined in Fig. 1. (A) Tree found in MP and ML analyses of total-evidence data set. (B) ML tree constraining Amborella + Nymphaeales. (C) ML tree constrained to hypothesis C.
Figure 3
Figure 3
Strict consensus of 16 MP trees obtained in analysis of the 104-taxon data set. Tree length = 23,864; consistency index = 0.394; retention index = 0.518. Bootstrap values (obtained by using 200 replicate searches with TBR with MULPARS turned off) for major clades of angiosperms are indicated above the branches.
Figure 4
Figure 4
50% majority rule tree derived from those trees sampled after “burn in.” Posterior probabilities are indicated above the branches.
Figure 5
Figure 5
Results of the likelihood ratio test with the parametric bootstrap, showing the distribution of δ (the likelihood ratio test statistic), which is the difference between the optimal trees supporting hypothesis B or C and hypothesis A for simulated data assuming that either hypothesis B or C is correct. The observed value for the actual data (represented by the arrow) is shown in relation to the distribution. If the observed value is much greater than the values found in the distribution, the null hypothesis is rejected. (a) With ML, the difference between optimal trees supporting hypothesis B compared with hypothesis A. The observed value is not significantly different from the values in the distribution (p ≈ 0.62). (b) With ML, the difference between optimal trees supporting hypothesis C compared with hypothesis A. The observed value is significantly different from the values in the distribution (p < 0.01). (c) With MP, the difference between optimal trees supporting hypothesis B compared with hypothesis A. The observed value is significantly different from the values in the distribution (p < 0.01). (d) With MP, the difference between optimal trees supporting hypothesis C compared with hypothesis A. The observed value is significantly different from the values in the distribution (p < 0.01).

References

    1. Mathews S, Donoghue M J. Science. 1999;286:947–950. - PubMed
    1. Parkinson C L, Adams K L, Palmer J D. Curr Biol. 1999;9:1485–1488. - PubMed
    1. Qiu Y-L, Lee J, Bernasconi-Quadroni F, Soltis D E, Soltis P S, Zanis M, Zimmer E A, Chen Z, Savolainen V, Chase M W. Nature (London) 1999;402:404–407. - PubMed
    1. Soltis P S, Soltis D E, Chase M W. Nature (London) 1999;402:402–404. - PubMed
    1. Soltis D E, Soltis P S, Chase M W, Mort M E, Albach D C, Zanis M, Savolainen V, Hahn W H, Hoot S B, Fay M F, et al. Bot J Linn Soc. 2000;133:381–461.

Publication types

LinkOut - more resources