. 2002 May 14;99(10):6955-60.
doi: 10.1073/pnas.102181599.

Human chronic lymphocytic leukemia modeled in mouse by targeted TCL1 expression

Affiliations

Human chronic lymphocytic leukemia modeled in mouse by targeted TCL1 expression

Roberta Bichi et al. Proc Natl Acad Sci U S A. .

Abstract

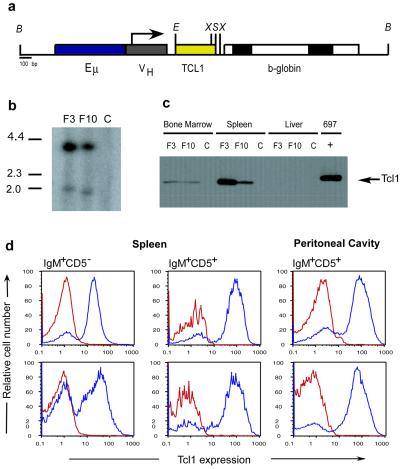
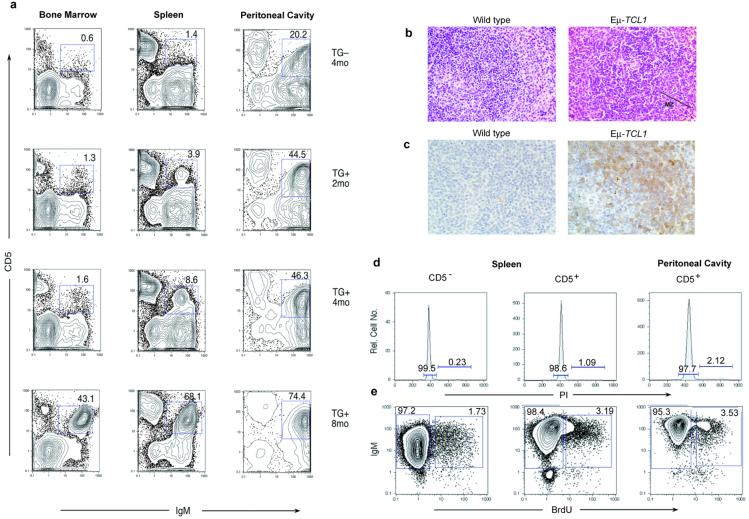
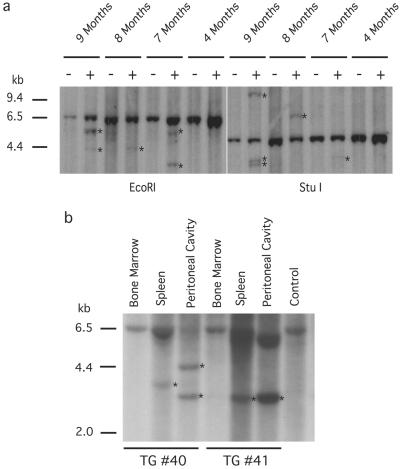
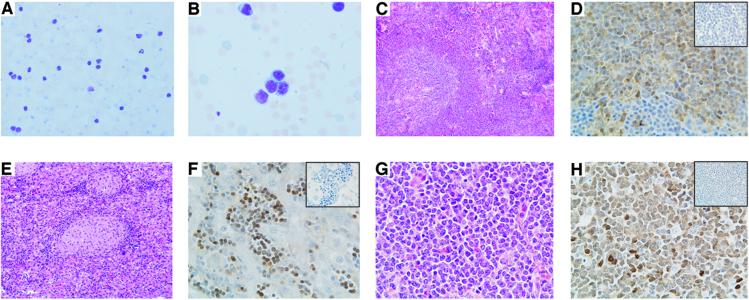
The TCL1 gene at 14q32.1 is involved in chromosomal translocations and inversions in mature T cell leukemias. These leukemias are classified either as T prolymphocytic leukemias, which occur very late in life, or as T chronic lymphocytic leukemias, which often arise in patients with ataxia telangiectasia (AT) at a young age. In transgenic animals, the deregulated expression of TCL1 leads to mature T cell leukemia, demonstrating the role of TCL1 in the initiation of malignant transformation in T cell neoplasia. Expression of high levels of Tcl1 have also been found in a variety of human tumor-derived B cell lines ranging from pre-B cell to mature B cell. Here we describe the phenotype of transgenic mice, E mu-TCL1, established with TCL1 under the control of a V(H) promoter-Ig(H)-E mu enhancer to target TCL1 expression to immature and mature B cells. Flow cytometric analysis reveals a markedly expanded CD5(+) population in the peritoneal cavity of E mu-TCL1 mice starting at 2 mo of age that becomes evident in the spleen by 3-5 mo and in the bone marrow by 5-8 mo. Analysis of Ig gene rearrangements indicates monoclonality or oligoclonality in these populations, suggesting a preneoplastic expansion of CD5(+) B cell clones, with the elder mice eventually developing a chronic lymphocytic leukemia (CLL)-like disorder resembling human B-CLL. Our findings provide an animal model for CLL, the most common human leukemia, and demonstrate that deregulation of the Tcl1 pathway plays a crucial role in CLL pathogenesis.


Figures

Figure 1
Figure 1
Production of Eμ-TCL1 transgenic (TG) mice. (a) Schematic representation of the construct used to generate the mice. Restriction sites: X, XhoI; S, SalI; E, EcoRV; B, BssHII. (b) Southern blot analysis of DNA isolated from the tails of the first TG progeny for both founders and non-TG control. (c) Immunoblot analysis on protein extracts from TG (F3 and F10) and non-TG (C = control) mouse tissues. 697 = pre-B leukemic cell line 697, which expresses high levels of Tcl1 protein (9). (d) TCL1 expression on gate subsets of splenic B cells. (Upper) Refers to the F3 progeny. (Lower) F10 progeny (Blue = TG, Red = non-TG).
Figure 2
Figure 2
Characterization of Eμ-TCL1 mice. (a) Correlation between IgM and CD5 expression in single cell suspensions from bone marrow, spleen, and peritoneal cavity in TG animals and a non-TG littermate. (b) Hematoxylin and eosin-stained spleen of mouse showing an expanded MZ in Εμ-TCL1 animals. (c) Immunodetection of Tcl1 protein in lymphoid cells of the MZ. (d) Cell cycle analysis on IgM and CD5 subsets of cells by PI-labeling. (e) Cell proliferation analysis by BrdUrd incorporation.
Figure 3
Figure 3
Analysis of IgH gene configuration. (a) IgH gene rearrangements were analyzed by Southern blot on EcoRI and StuI-digested splenocyte DNAs. Transgenic mice (+) of 7, 8, and 9 mo show rearranged bands (asterisks). No predominant rearrangement is observed in the youngest mice. Controls (−) are non-TG mice with the genomic 6.5-kb EcoRI and 4.7-kb StuI fragments. (b) Southern blots on DNA isolated from bone marrow, spleen, and peritoneal cavity of TG mice (nos. 40 and 41) with the CD5+/IgM+ expanded population. IgH gene predominant rearrangements were detected in spleen and peritoneal cavity (asterisks). DNA from spleen of non-TG mouse was used as control.
Figure 4
Figure 4
Histopathological analysis of the Eμ-TCL1 mice. (A) Blood smear stained with Wright Giemsa showing an increased number of circulating lymphocytes. (B) High magnification of the blood smear. (C) Histology of spleen, liver (E), and cervical lymph node (G) after hematoxylin-eosin staining. (D) Immunodetection of Tcl1 protein in spleen, liver (F), and cervical lymph node (H). (Insets) Negative control in which the primary antibody has been omitted.
Figure 5
Figure 5
Southern blot analysis of IgH gene rearrangements in leukemias from TG mice. DNAs from leukemic mice and a littermate control were digested with StuI. The strong 4.7-kb bands represent the gene in its germ-line configuration. Clonal rearrangements are indicated by asterisks. Lanes 1 and 2, Leukemic mice from TG line F3; lanes 3 and 4, leukemic mice from TG line F10; lane 5, non-TG mouse.

Similar articles

Cited by

References

    1. Rai K, Patel D C. In: Hematology: Basic Principles and Practice. Hoffman R, Banz E J Jr, Shattil S J, editors. New York: Churchill Livingstone; 1995. pp. 1308–1321.
    1. Landis S H, Murray T, Bolden S, Wingo P A. CA Cancer J Clin. 1998;48:6–29. - PubMed
    1. Caligaris-Cappio F, Gobbi M, Bofill M, Janossy G. J Exp Med. 1982;155:623–628. - PMC - PubMed
    1. Boumsell L, Bernard A, Lepage V, Degos L, Lemerle J, Dausset J, L. Eur J Immunol. 1978;8:900–904. - PubMed
    1. Kantor A B. Immunol Today. 1991;12:389–391. - PubMed

Publication types

MeSH terms