. 2002 May 14;99(10):6967-72.
doi: 10.1073/pnas.102172399.

Initiating oncogenic event determines gene-expression patterns of human breast cancer models

Affiliations

Initiating oncogenic event determines gene-expression patterns of human breast cancer models

Kartiki V Desai et al. Proc Natl Acad Sci U S A. .

Erratum in

  • Proc Natl Acad Sci U S A 2002 Jul 23;99(15):10227

Abstract

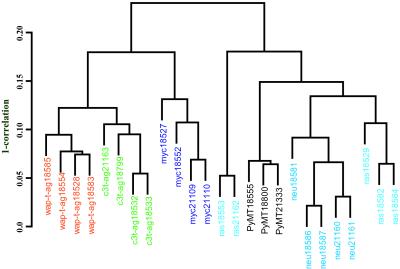
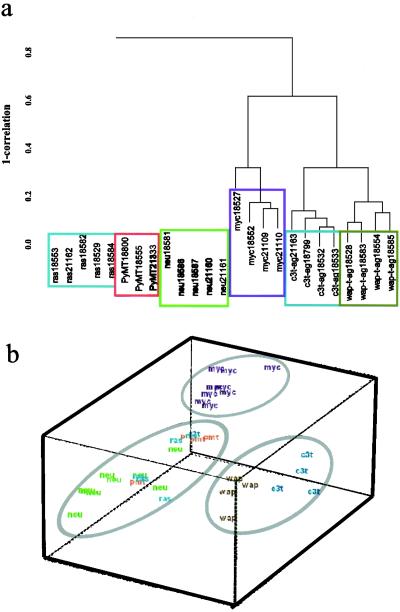
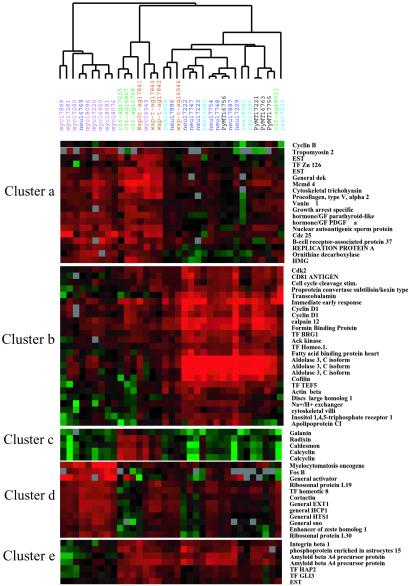
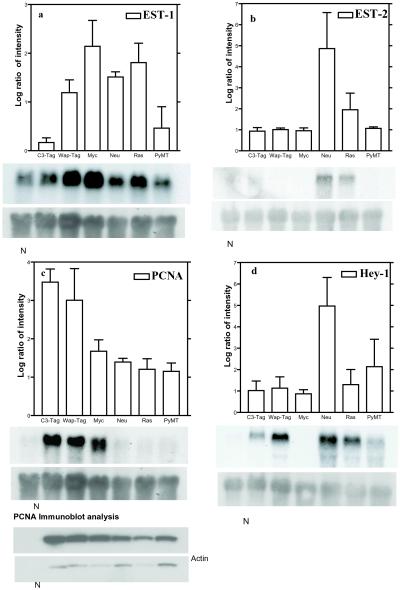
Molecular expression profiling of tumors initiated by transgenic overexpression of c-myc, c-neu, c-ha-ras, polyoma middle T antigen (PyMT) or simian virus 40 T/t antigen (T-ag) targeted to the mouse mammary gland have identified both common and oncogene-specific events associated with tumor formation and progression. The tumors shared great similarities in their gene-expression profiles as compared with the normal mammary gland with an induction of cell-cycle regulators, metabolic regulators, zinc finger proteins, and protein tyrosine phosphatases, along with the suppression of some protein tyrosine kinases. Selection and hierarchical clustering of the most variant genes, however, resulted in separating the mouse models into three groups with distinct oncogene-specific patterns of gene expression. Such an identification of targets specified by particular oncogenes may facilitate development of lesion-specific therapeutics and preclinical testing. Moreover, similarities in gene expression between human breast cancers and the mouse models have been identified, thus providing an important component for the validation of transgenic mammary cancer models.


Figures

Figure 1
Figure 1
Comparison of mouse models of cancer. A dendrogram depicting the degree of similarity between the six mouse models of human cancer is shown. Average linkage hierarchical clustering using Pearson correlation similarity was carried out for all genes studied with at least a two-fold geometric mean relative to the normal mammary gland (reference RNA). The scale on the right shows 1 minus correlation. The high correlation coefficients suggest that the tumors are highly similar in their gene-expression profiles, irrespective of the initiating oncogenic event.
Figure 2
Figure 2
Comparative cDNA microarray analysis of mouse models of human breast cancer. (a) A subset of 930 genes selected by F test (P < 0.001) were clustered as described in Methods to determine oncogene-specific signatures. The tumors fall into three distinct groups: (i) MMTV-neu, MMTV-ras, and MMTV-PyMT; (ii) MMTV-myc; and (iii) the T antigen group. (b) Data are represented in three dimensions by multidimensional scaling.
Figure 3
Figure 3
Oncogene-specific clusters spanning interesting variant genes are shown. Each tumor type is color-coded; gene names are shown on the right-hand side of the figure. Complete hierarchical clustering of the 258 genes and 672 genes that varied significantly by F test (P < 0.001) in their expression profiles across the tumors studied are shown in Fig. 6 a and b, respectively.
Figure 4
Figure 4
Comparison of microarray and Northern blot analysis. The average log ratio of intensity (to the base 2) observed by microarray hybridization for each selected gene is depicted as a bar graph and is plotted on the y axis, with the tumor type on the x axis. (Bars = SD.) The results of Northern blot analysis performed for the gene are shown below each bar graph. Tumor samples are listed on the top of each lane of the Northern blot; the N lane denotes normal mammary gland RNA sample. (a) EST-1. (b) EST-2. PCNA and Hey-1 were modulated in an oncogene-specific manner (c and d, respectively). The differential regulation of PCNA was retained at the protein level by Western blot. 18S rRNA was used as an internal control for RNA quantification for Northern blots.

References

    1. Perou C M, Sorlie T, Eisen M B, van de Rijn M, Jeffrey S S, Rees C A, Pollack J R, Ross D T, Johnsen H, Akslen L A, et al. Nature (London) 2000;406:747–752. - PubMed
    1. Perou C M, Jeffrey S S, van de Rijn M, Rees C A, Eisen M B, Ross D T, Pergamenschikov A, Williams C F, Zhu S X, Lee J C, et al. Proc Natl Acad Sci USA. 1999;96:9212–9217. - PMC - PubMed
    1. Hedenfalk I, Duggan D, Chen Y, Radmacher M, Bittner M, Simon R, Meltzer P, Gusterson B, Esteller M, Kallioniemi O P, et al. N Engl J Med. 2001;344:539–548. - PubMed
    1. Bieche I, Lidereau R. Genes Chromosomes Cancer. 1995;4:227–251. - PubMed
    1. Cardiff R D, Anver M R, Gusterson B A, Hennighausen L, Jensen R A, Merino M J, Rehm S, Russo J, Tavassoli F A, Wakefield L M, et al. Oncogene. 2000;19:968–988. - PubMed

Publication types

Substances