

Muscle glycogen content and glucose uptake during exercise in humans: influence of prior exercise and dietary manipulation
- PMID: 12015435
- PMCID: PMC2290308
- DOI: 10.1113/jphysiol.2001.015594
Muscle glycogen content and glucose uptake during exercise in humans: influence of prior exercise and dietary manipulation
Abstract
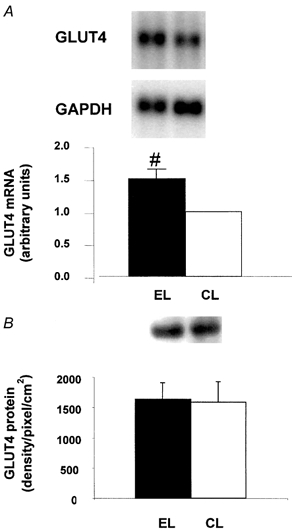
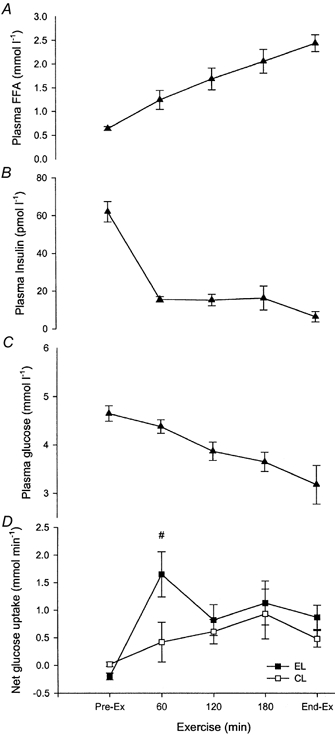
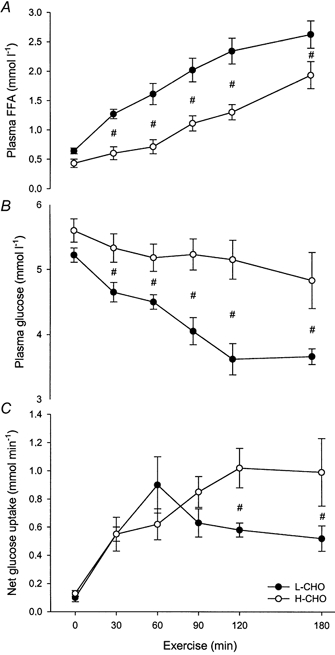
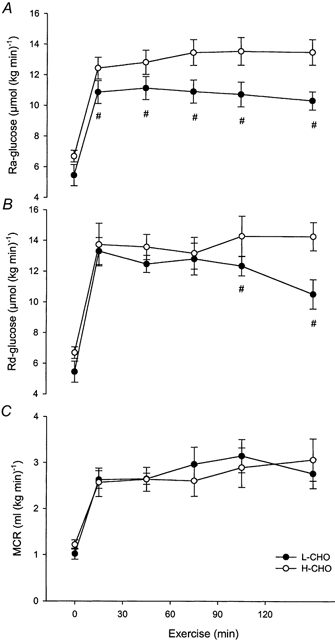
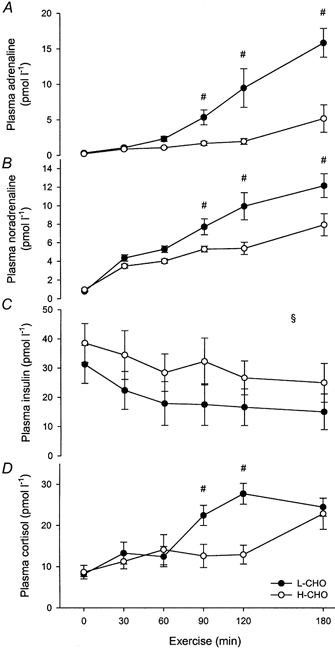
There are many factors that can influence glucose uptake by contracting skeletal muscle during exercise and although one may be intramuscular glycogen content, this relationship is at present not fully elucidated. To test the hypothesis that muscle glycogen concentration influences glucose uptake during exercise, 13 healthy men were studied during two series of experiments. Seven men completed 4 h of two-legged knee extensor exercise 16 h after reducing of muscle glycogen by completing 60 min of single-legged cycling (Series 1). A further six men completed 3 h of two-legged knee extensor exercise on two occasions: one after 60 min of two-legged cycling (16 h prior to the experimental trial) followed by a high carbohydrate diet (HCHO) and the other after the same exercise followed by a low carbohydrate diet (LCHO) (Series 2). Muscle glycogen was decreased by 40 % when comparing the pre-exercised leg (EL) with the control leg (CL) prior to exercise in Series 1. In addition, muscle glycogen was decreased by the same magnitude when comparing LCHO with HCHO in Series 2. In Series 1, glucose uptake was 3-fold higher in the first 60 min of exercise, in the presence of unchanged pre-exercise GLUT4 protein in EL compared with CL, suggesting that the lower glycogen, and not the exercise the day before, might have provided the stimulus for increased glucose uptake. Despite the same magnitude of difference in pre-exercise glycogen concentration when comparing Series 1 with Series 2, neither direct-nor isotopic tracer-determined glucose uptake was higher in LCHO compared with HCHO in Series 2. However, arterial concentrations of insulin and glucose were lower, while free fatty acids and adrenaline were higher in LCHO compared with HCHO. These data suggest that pre-exercise glycogen content may influence glucose uptake during subsequent exercise. However, this is only the case when delivery of substrates and hormones remains constant. When delivery of substrates and hormones is altered, the potential effect of glycogen on glucose uptake is negated.
Figures
Similar articles
-
Influence of pre-exercise muscle glycogen content on exercise-induced transcriptional regulation of metabolic genes.J Physiol. 2002 May 15;541(Pt 1):261-71. doi: 10.1113/jphysiol.2002.016832. J Physiol. 2002. PMID: 12015434 Free PMC article. Clinical Trial.
-
Exercise metabolism in human skeletal muscle exposed to prior eccentric exercise.J Physiol. 1998 May 15;509 ( Pt 1)(Pt 1):305-13. doi: 10.1111/j.1469-7793.1998.305bo.x. J Physiol. 1998. PMID: 9547403 Free PMC article. Clinical Trial.
-
Early postexercise muscle glycogen recovery is enhanced with a carbohydrate-protein supplement.J Appl Physiol (1985). 2002 Oct;93(4):1337-44. doi: 10.1152/japplphysiol.00394.2002. J Appl Physiol (1985). 2002. PMID: 12235033
-
The putative roles of adenosine in insulin- and exercise-mediated regulation of glucose transport and glycogen metabolism in skeletal muscle.Can J Appl Physiol. 2002 Apr;27(2):152-78. doi: 10.1139/h02-011. Can J Appl Physiol. 2002. PMID: 12184210 Review.
-
Insulin Sensitization Following a Single Exercise Bout Is Uncoupled to Glycogen in Human Skeletal Muscle: A Meta-analysis of 13 Single-Center Human Studies.Diabetes. 2022 Nov 1;71(11):2237-2250. doi: 10.2337/db22-0015. Diabetes. 2022. PMID: 36265014 Review.
Cited by
-
Insulin Resistance Does Not Impair Mechanical Overload-Stimulated Glucose Uptake, but Does Alter the Metabolic Fate of Glucose in Mouse Muscle.Int J Mol Sci. 2020 Jul 1;21(13):4715. doi: 10.3390/ijms21134715. Int J Mol Sci. 2020. PMID: 32630335 Free PMC article.
-
Acute interleukin-6 administration does not impair muscle glucose uptake or whole-body glucose disposal in healthy humans.J Physiol. 2003 Apr 15;548(Pt 2):631-8. doi: 10.1113/jphysiol.2002.032938. Epub 2003 Mar 14. J Physiol. 2003. PMID: 12640021 Free PMC article. Clinical Trial.
-
Complex systems model of fatigue: integrative homoeostatic control of peripheral physiological systems during exercise in humans.Br J Sports Med. 2005 Jan;39(1):52-62. doi: 10.1136/bjsm.2003.011247. Br J Sports Med. 2005. PMID: 15618343 Free PMC article. Review.
-
Endurance exercise with reduced muscle glycogen content influences substrate utilization and attenuates acute mTORC1- and autophagic signaling in human type I and type II muscle fibers.Skelet Muscle. 2025 Mar 25;15(1):9. doi: 10.1186/s13395-025-00377-3. Skelet Muscle. 2025. PMID: 40128889 Free PMC article.
-
Glucose ingestion attenuates interleukin-6 release from contracting skeletal muscle in humans.J Physiol. 2003 Jun 1;549(Pt 2):607-12. doi: 10.1113/jphysiol.2003.042374. Epub 2003 Apr 17. J Physiol. 2003. PMID: 12702735 Free PMC article. Clinical Trial.
References
-
- Campbell SE, Febbraio MA. Effect of ovarian hormones on GLUT4 expression and contraction-stimulated glucose uptake. American Journal of Physiology - Endocrinology and Metabolism. 2001;282:E1139–1146. - PubMed
-
- Chomczynski P, Sacchi N. Single-step method of RNA isolation by acid guanidium thiocyanate-phenol-chloroform extraction. Analytical Biochemistry. 1987;162:156–159. - PubMed
Publication types
MeSH terms
Substances
LinkOut - more resources
Full Text Sources
Other Literature Sources
Medical