. 2002 May 15;22(10):4142-52.
doi: 10.1523/JNEUROSCI.22-10-04142.2002.

The spatial dimensions of electrically coupled networks of interneurons in the neocortex

Affiliations

The spatial dimensions of electrically coupled networks of interneurons in the neocortex

Yael Amitai et al. J Neurosci. .

Abstract

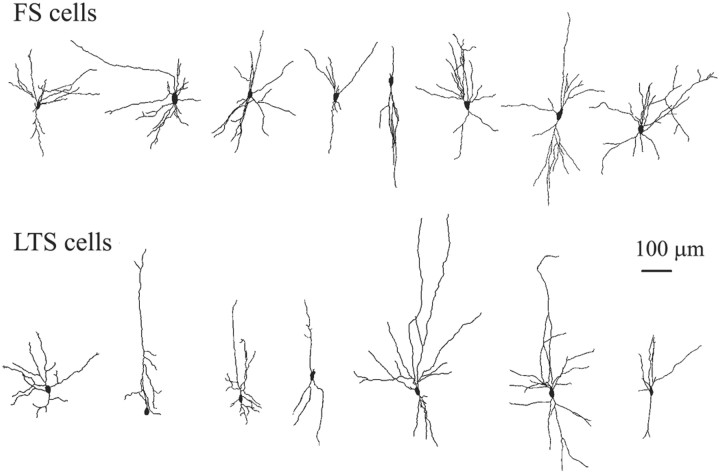
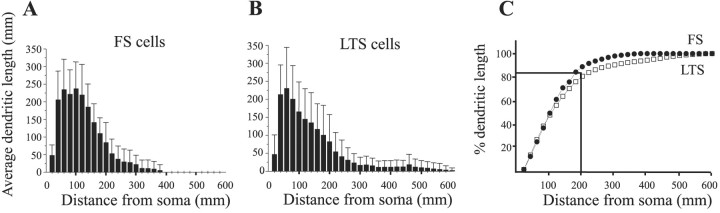
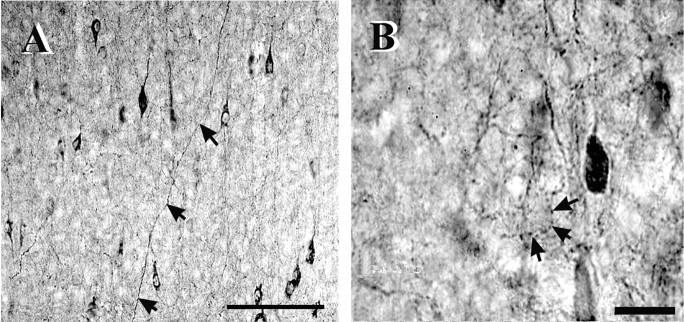
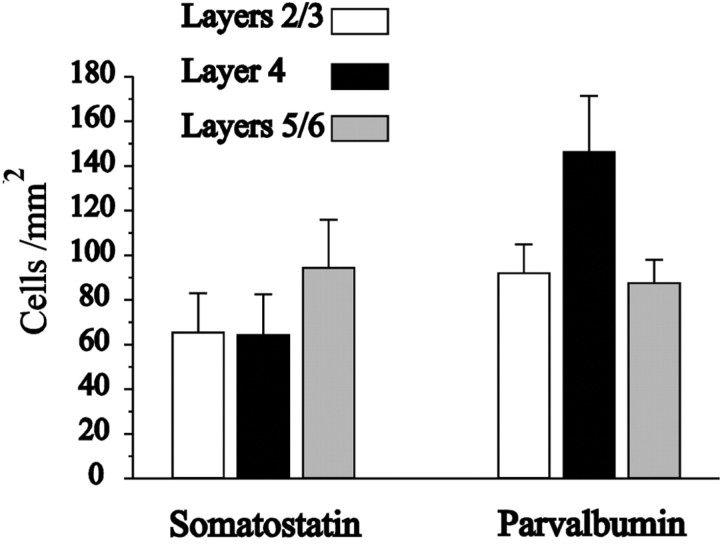
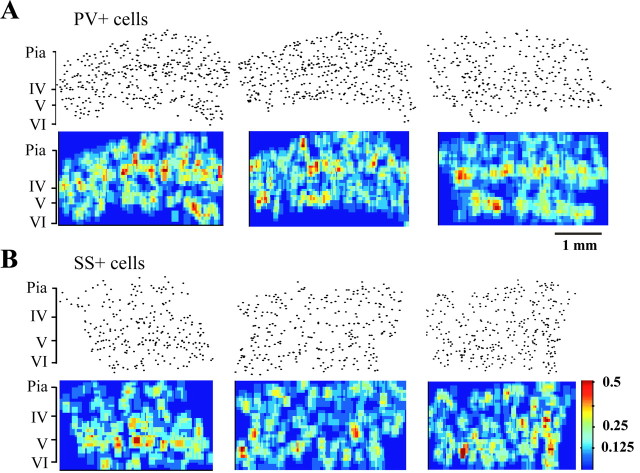
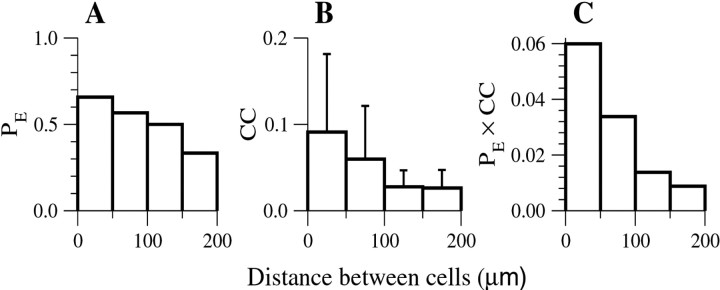
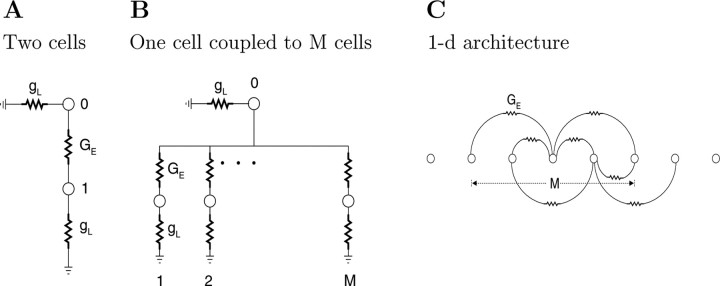
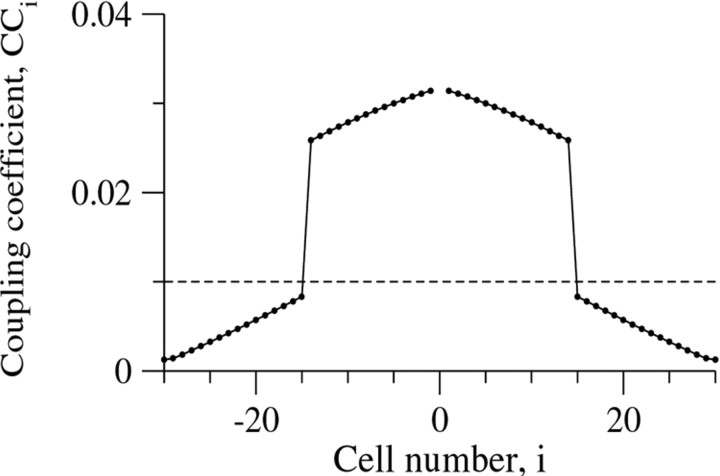
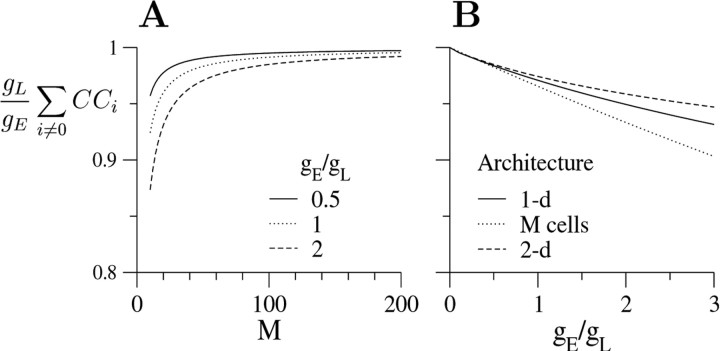
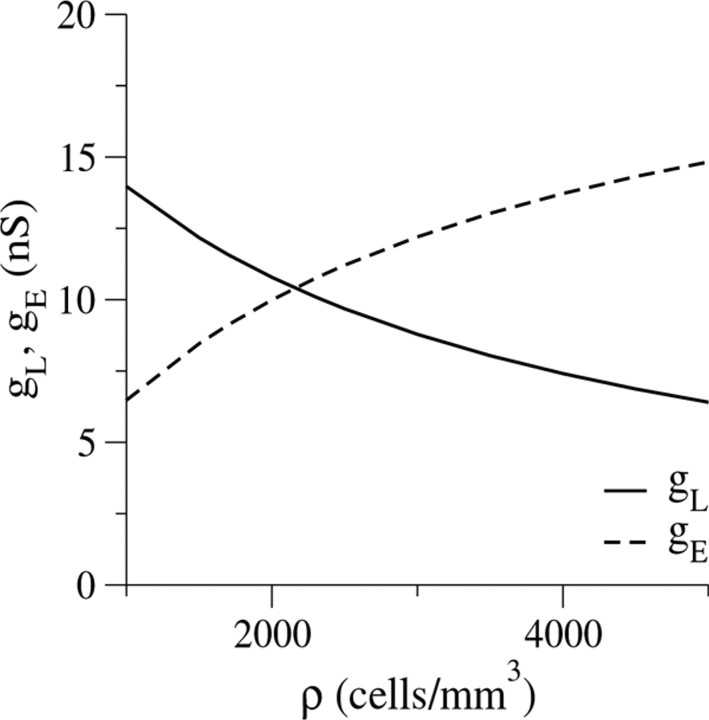
Inhibitory interneurons of the neocortex are electrically coupled to cells of the same type through gap junctions. We studied the spatial organization of two types of interneurons in the rat somatosensory cortex: fast-spiking (FS) parvalbumin-immunoreactive (PV+) cells, and low threshold-spiking (LTS) somatostatin-immunoreactive (SS+) cells. Paired recordings in layer 4 demonstrated that both the probability of coupling and the coupling coefficient drop steeply with intersomatic distance, reaching zero beyond 200 microm. The dendritic arbors of FS and LTS cells were reconstructed from electrophysiologically characterized, biocytin-filled cells; the two cell types had only minor differences in the number and span of their dendrites. However, there was a markedly higher density of PV+ cells than SS+ cells. PV+ cells were densest in layer 4, while SS+ cell density peaked in the subgranular layers. From these data we estimate that there is measurable electrical coupling (directly or indirectly via intermediary cells) between each interneuron and 20-50 others. The large number of electrical synapses implies that each interneuron participates in a large, continuous syncytium. To evaluate the functional significance of these findings, we examined several simple architectures of coupled networks analytically. We present a mathematical method to estimate the average summated coupling conductance that each cell receives from all of its neighbors, and the average leak conductance of individual cells, and we suggest that these have the same order of magnitude. These quantitative results have important implications for the effects of electrical coupling on the dynamic behavior of interneuron networks.


Figures

Fig. 1.
Fig. 1.
The soma-dendritic morphology of FS and LTS cells is rather variable.
Fig. 2.
Fig. 2.
Sholl analysis of the inhibitory neurons from Figure 1 reveals more primary branches for FS cells (A) and a “tail” of longer branches in LTS cells (B). Comparing the cumulative length of the two cell types shows that for both, 80–90% of the dendrites occurred within 200 μm of the soma. FS cells, closed circles; LTS cells,open squares.
Fig. 3.
Fig. 3.
Immunohistochemistry for somatostatin (A) and parvalbumin (B) in layer 4.Arrows in A point to a somatostatin-positive axon crossing upward. Arrows in B point to punctate parvalbumin-positive terminal staining around the somata of cells. Scale bars: A, 100 μm; B, 20 μm.
Fig. 4.
Fig. 4.
Average density of somatostatin-positive and parvalbumin-positive cells in the different cortical laminas.
Fig. 5.
Fig. 5.
The spatial distribution of parvalbumin-positive cells (A) and somatostatin-positive cells (B). Three-example sections of each cell type are presented. The top panels depict the raw data. Thebottom panels illustrate by color-coding the average cell density in bins of 30 × 50 μm, deducted from a smoothing process of 4 × 4 such bins. Note that the maximal density observed was 0.5 cells/bin (red), thus eight cells in a rectangle of 120 × 200 μm. The corresponding cortical laminas are marked to the left.
Fig. 6.
Fig. 6.
Histograms of the probability PE that two cells are coupled (A), the coupling coefficient CC (B) and PE × CC (C) as a function of the distance between the cells. Data are based on recordings from pairs of both FS and LTS cells.
Fig. 7.
Fig. 7.
Architectures of network models. A, Two cells coupled by a gap junction with a conductance GE. B, A cell (0) coupled to M other cells. C, One-dimensional architecture. Each cell is coupled to M/2 cells on its left and M/2 cells on its right. Each coupling connection in B and C has a conductance GE = gE/ M. Cells in all architectures have a leak conductance gL (not specified in C).
Fig. 8.
Fig. 8.
The coupling coefficient, CCi, as a function of the cell number i for a one-dimensional architecture with M = 28 and gE/ gL = 1. The values were computed either by solving Equation 3 or by numerical integration of Equation 11; the two results are equal. Note the jump in CCi between cells 14 and 15 (i = M/2 and i = M/2 + 1). Thedashed line denotes the confidence level of CC = 0.01.
Fig. 9.
Fig. 9.
Effects of network architectures on (gL/ gE) ∑i≠0 CCi. A, The dependence of (gL/ gE) ∑i≠0 CCi at steady state on M for one-dimensional architecture and three values of gE/ gL: 0.5 (solid line), 1 (dotted line), and 2 (dashed line).B, The dependence of (gL/ gE) ∑i≠0 CCi at steady state on gE/ gL for three architectures: one-dimensional architecture (solid line), one cell coupled to M other cells (dotted line), and two-dimensional architecture (dashed line). M = 28 for all the architectures. Calculations for the one-dimensional architecture were carried out as in Figure 8. Equation9 was used for calculating CC for the architecture with one cell coupled to M other cells. In the two-dimensional architecture, cells are located on a two-dimensional grid, at positions x = (iΔ, jΔ), where i and j are integers and Δ is the grid unit length. Cells at positions (i1, j1) and (i2, j2) are coupled if (i1i2)2+(j1j2)2≤ 3. Calculations were performed by solving Equation 3.
Fig. 10.
Fig. 10.
The dependence of gL(solid line) and gE (dashed line) on the cell density ρ, calculated using Equations EB3 andEB4, for the data obtained experimentally.

References

    1. Agmon A, Connors BW. Thalamocortical responses of mouse somatosensory (barrel) cortex in vitro. Neuroscience. 1991;41:365–379. - PubMed
    1. Akil M, Lewis DA. Differential distribution of parvalbumin-immunoreactive pericellular clusters of terminal boutons in developing and adult monkey neocortex. Exp Neurol. 1992;115:239–249. - PubMed
    1. Andreu E, Fernández E, Louis E, Ortega G, Sánchez-Andrés JV. Role of architecture in determining passive electrical properties in gap junction-connected cells. Pflügers Arch-Eur J Physiol. 2000;439:789–797. - PubMed
    1. Bayraktar T, Welker E, Freund TF, Zilles K, Staiger JF. Neurons immunoreactive for vasoactive intestinal polypeptide in the rat primary somatosensory cortex: morphology and spatial relationship to barrel-related columns. J Comp Neurol. 2000;420:291–304. - PubMed
    1. Beierlein M, Gibson JR, Connors BW. A network of electrically coupled interneurons drives synchronized inhibition in neocortex. Nat Neurosci. 2000;3:904–910. - PubMed

Publication types

MeSH terms

LinkOut - more resources