. 2002 May 27;157(5):851-64.
doi: 10.1083/jcb.200108150. Epub 2002 May 20.

Identification of a novel population of muscle stem cells in mice: potential for muscle regeneration

Affiliations

Identification of a novel population of muscle stem cells in mice: potential for muscle regeneration

Zhuqing Qu-Petersen et al. J Cell Biol. .

Abstract

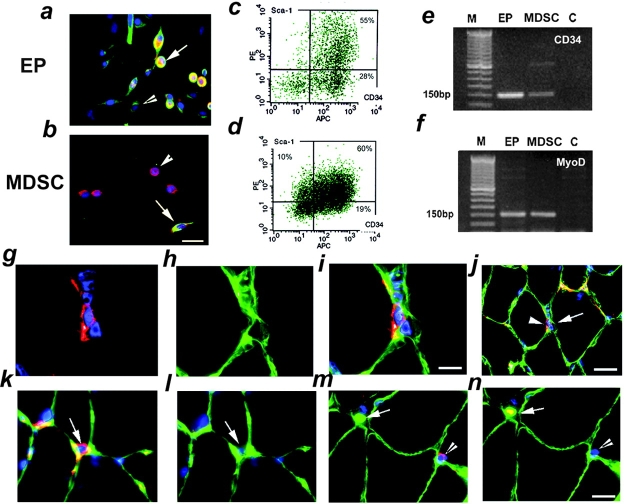
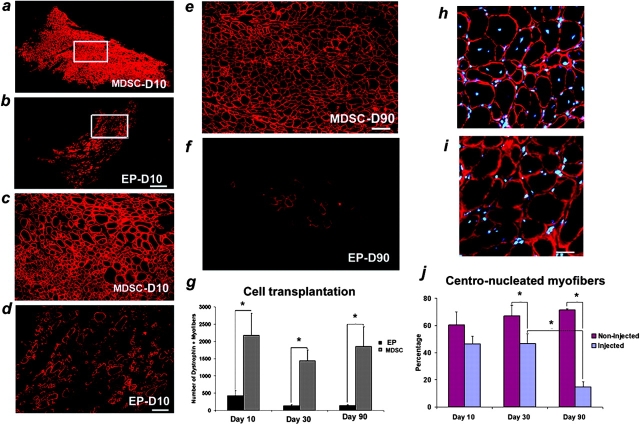
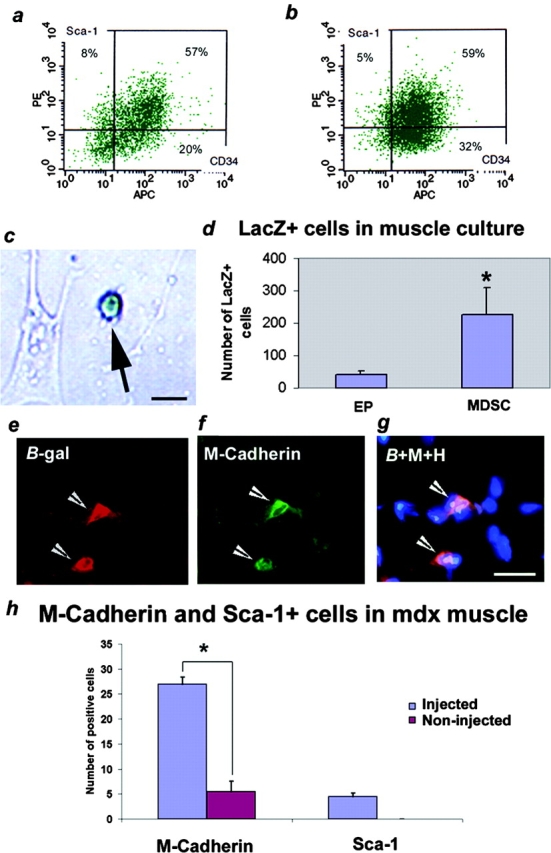
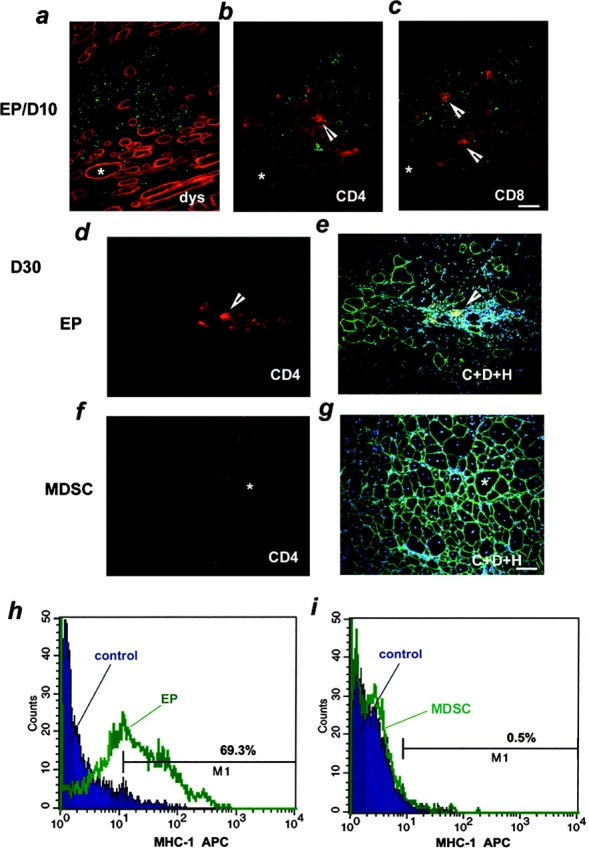
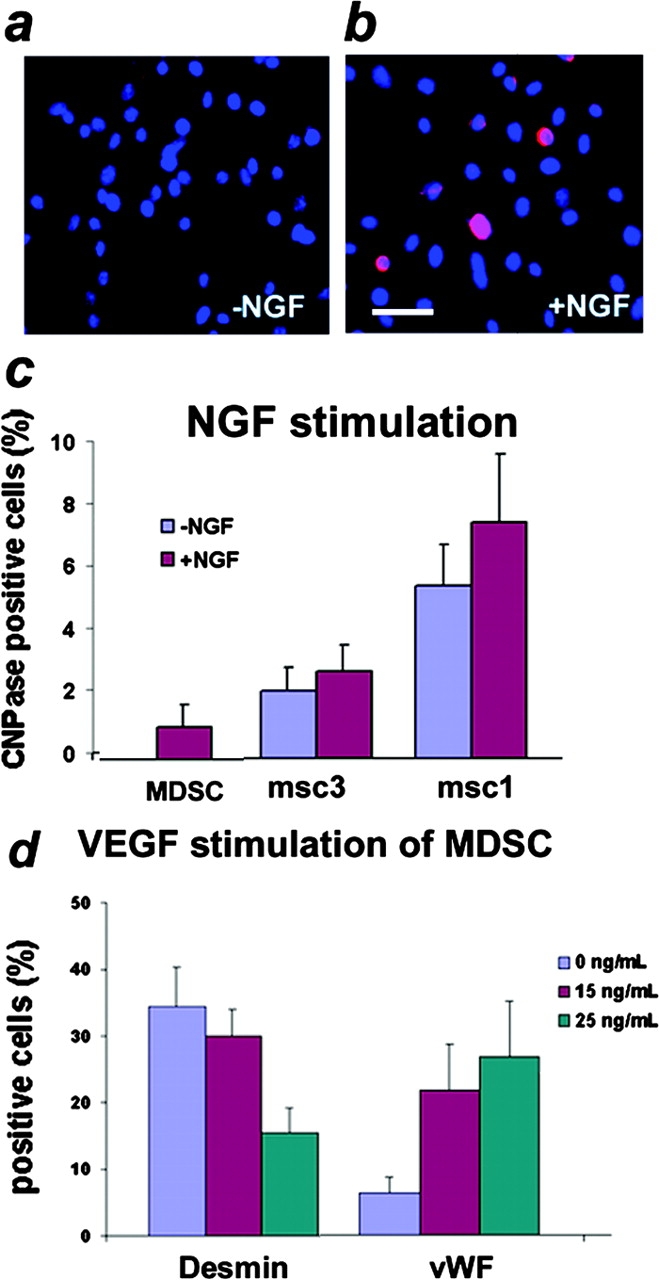
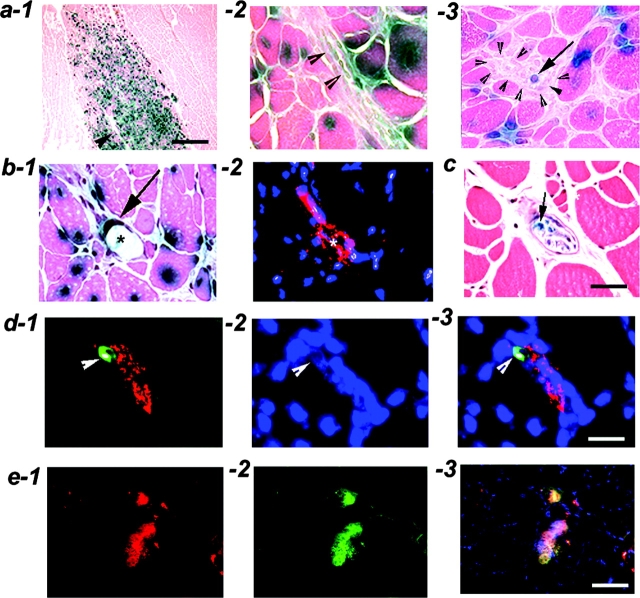
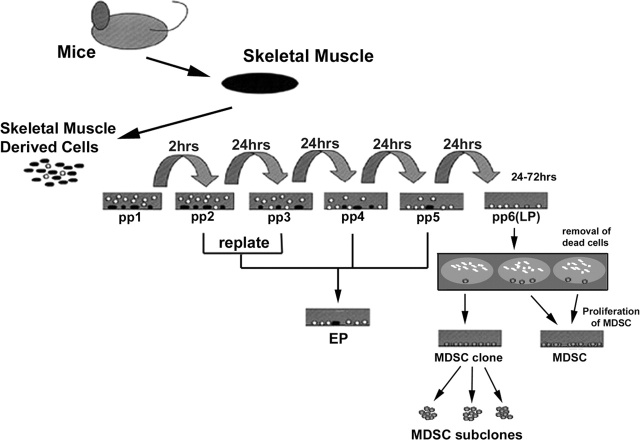
Three populations of myogenic cells were isolated from normal mouse skeletal muscle based on their adhesion characteristics and proliferation behaviors. Although two of these populations displayed satellite cell characteristics, a third population of long-time proliferating cells expressing hematopoietic stem cell markers was also identified. This third population comprises cells that retain their phenotype for more than 30 passages with normal karyotype and can differentiate into muscle, neural, and endothelial lineages both in vitro and in vivo. In contrast to the other two populations of myogenic cells, the transplantation of the long-time proliferating cells improved the efficiency of muscle regeneration and dystrophin delivery to dystrophic muscle. The long-time proliferating cells' ability to proliferate in vivo for an extended period of time, combined with their strong capacity for self-renewal, their multipotent differentiation, and their immune-privileged behavior, reveals, at least in part, the basis for the improvement of cell transplantation. Our results suggest that this novel population of muscle-derived stem cells will significantly improve muscle cell-mediated therapies.


Figures

Figure 1.
Figure 1.
Phenotypes of EP cells and MDSC in cultures and in normal muscle sections. (a and b) Immunostaining revealed that in the EP culture (a), most of the cells are desmin+ (green, arrowhead), and some cells coexpressed a high level of Sca-1 (red, arrow). In contrast, many cells in the MDSC culture (b) expressed Sca-1 (red, arrowhead), but only 30–40% of these cells expressed desmin (green, arrow). (c and d) Flow cytometry showed that in the EP culture (c), 83% of the cells expressed CD34, and 55% of the cells coexpressed CD34/Sca-1. In the MDSC culture (d), 79% of the cells expressed CD34, and 60% of the cells coexpressed CD34/Sca-1. Unlike the EP culture (c), the MDSC culture (d) contained a population (10%) of cells that were Sca-1+ and CD34. (e and f) RT-PCR for CD34 (e) and MyoD, an early stage marker of myogenesis (f), showed that the two populations (EP cells and MDSC) express both CD34 and MyoD. M, markers; C, control MDSC without reverse transcriptase. (i and j) Immunostaining of muscle cross sections prepared from normal mice showed that Sca-1–expressing cells (g, red) were found beneath the basement membrane, as revealed by laminin staining (h–j, green). The arrowhead in j is showing the Sca-1–expressing cells, whereas the arrow is showing the basal lamina expressing laminin. The nuclei were revealed by Hoechst staining (g, i, and j). (k–m) Colocalization of m-cadherin (Cy5, red), Sca-1 (PE, red), laminin (FITC, green), and nuclei (blue) confirmed that the Sca-1–expressing cells (k, arrow) did not colocalize with m-cadherin+ cells (l, arrow). Similarly, the m-cadherin+ cells (m, arrowhead) did not colocalize with Sca-1–expressing cells (n, arrowhead). Notice that the capillaries are also Sca-1+ (m and n, arrows). Bars: (a, b, and k–n) 50 μm; (g–i) 25 μm; (j) 100 μm.
Figure 2.
Figure 2.
Dystrophin expression in mdx skeletal muscle after MDSC and EP cell transplantation. (a–g) Many dystrophin+ myofibers were detected in both MDSC-injected muscle (a) and the EP cell–injected muscle (b) at 10 d after injection; however, the number of dystrophin+ myofibers was significantly higher in the MDSC-injected muscle (g). Boxed regions in a and b are enlarged in c and d, and show that the MDSC- injected muscle contained many more small dystrophin+ myofibers (c) than the EP cell–injected muscle (d). Many dystrophin+ myofibers were still observed at 90 d after injection of MDSC (e), whereas very few were observed in EP cell–injected muscles (f). The number of dystrophin+ myofibers was significantly higher in the MDSC-injected muscle than in the EP cell–injected muscle at all time points analyzed (g; *P < 0.01, n = 3–5 animals/group). (h–j) MDSC-injected muscle sections containing dystrophin staining (red) were also counterstained with Hoechst (blue) to reveal the location of nuclei. Many dystrophin+ myofibers were centronucleated at 30 d after implantation (h), but a significant decrease in the number of centronucleated myofibers occurred by 90 d after injection (i). We observed no difference in the percentage of centronucleated myofibers between injected and noninjected areas at 10 d after injection (j). However, at 30 and 90 d after transplantation, the number of centronucleated myofibers was significantly lower (*P < 0.01, n = 3 muscles/condition) at the injected site than at the noninjected site. Bars: (a and b) 500 μm; (c and d) 50 μm; (e and f) 150 μm; (h and i) 25 μm.
Figure 3.
Figure 3.
Self-renewal ability of MDSC and EP cells. (a and b) Flow cytometric analysis of CD34 and Sca-1 expression of MDSC (at passage 30) (a) and subcloned MDSC (b). Of the MDSC at passage 30, 77% were CD34+, 57% were CD34+/Sca-1+, and 8% were CD34/Sca-1+, which is very similar to observations of the MDSC at passage 10 (Fig. 2 d). A subclone culture displayed a similar pattern of phenotypes: 91% of the cells were CD34+; 59% were CD34+/Sca-1+; and 5% were CD34/Sca-1+ (b). (c and d) EP cells and MDSC were transduced with a retrovirus encoding for the lacZ reporter gene and injected into mdx hindlimb muscle. LacZ+ muscle-derived cells (c, arrow) were isolated from the injected dystrophic muscles 30 d after transplantation. Up to five times more lacZ + cells were observed in the cultures prepared from the MDSC-injected muscle than in those prepared from the EP cell–injected muscle (d; *P < 0.05, n = 3 cultures). (e–g) To reveal the donor-derived satellite cells, some MDSC-injected muscles were sectioned, and β-galactosidase (red) was colocalized with m-cadherin (green) and Hoechst (blue) by immunohistochemistry. β-Galactosidase+ cells (e, arrowheads) expressing m-cadherin (f, arrowheads), which colocalized with nuclei (g, arrowheads; triple exposure), were detected in transplanted muscle. (h) We further performed immunochemistry to evaluate the number of m-cadherin+ and Sca-1+ cells in MDSC-injected muscle at 90 d after injection. The number of m-cadherin+ and Sca-1+ cells was higher (*P < 0.01, n = 3 muscles/experiment) in the injected site (dystrophin+ myofibers) than in the noninjected site (dystrophin myofibers). (Panel g) B, β-galactosidase staining; M, m-cadherin staining; H, Hoechst staining. Bars: (c) 25 μm; (e–g) 50 μm.
Figure 4.
Figure 4.
Detection of CD4 and CD8 lymphocytes in transplanted muscles and characterization of MHC-1 expression on MDSC and EP cells. (a–c) Immunostaining for dystrophin (dys; a), CD4 (b), and CD8 (c) cells was performed in muscle serial sections prepared from EP cell–injected muscles. By 10 d after injection (EP/D10), we detected both CD4 (b, arrowhead) and CD8 (c, arrowheads) lymphocytes in the injected area, as revealed by the green beads and the presence of numerous dystrophin+ myofibers (a–c). Stars in a–c indicate the same muscle fiber in serial muscle sections. (d–g) We also performed immunostaining to colocalize CD4 (red) and dystrophin (green) in MDSC- and EP cell–injected muscles, which were counterstained with Hoechst (blue) at 30 d after injection (D30). We observed some CD4+ cells in the EP cell–transplanted areas (d, arrowhead) in mdx muscles. In these areas, we also observed a dramatic decrease in the number of dystrophin+ myofibers (e). In contrast, we detected an absence of CD4+ cells in the MDSC-injected muscle (f) despite the presence of a large number of dystrophin+ myofibers at 30 d after transplantation (g). In e and g, the letters C, D, and H represent the colocalization of CD4, dystrophin, and Hoechst. The stars in f and g show the same myofibers. (h and i) We analyzed the percentage of MHC-1– expressing cells on the MDSC and EP cell populations by flow cytometry. The MDSC were almost completely negative (0.5%) for the MHC-1 (i), whereas 69.3% of the EP cells were positive for MHC-1 (h). Bars, 100 μm.
Figure 5.
Figure 5.
Multipotent differentiation of MDSC in vitro. (a–c) Immunostaining was performed on MDSC and the subclones of MDSC with or without stimulation by NGF. MDSC without stimulation did not express CNPase (a), whereas some cells became CNPase+ in the presence of NGF-supplemented (10 ng/ml) medium for 5 d (b). Hoechst staining showed the total number of cells in culture (a and b). Interestingly, we detected CNPase+ cells in two of the subclone cultures, msc1 and msc3, before NGF stimulation (c). However, the percentage of CNPase+ cells was increased in all cell populations when incubated with NGF-supplemented medium for 5 d (c). (d) We also detected vWF+ MDSC without VEGF stimulation, and the percentage of vWF+ cells increased in the presence of VEGF-supplemented medium (15 and 25 ng/ml). We also observed that the number of desmin+ cells decreased after stimulation with VEGF. Bar, 50 μm.
Figure 6.
Figure 6.
Multipotent differentiation of MDSC in the injected skeletal muscle in vivo. 10 (a) and 25 d (b–e) after transplantation. (a-1–a-3) MDSC that were genetically engineered to express the lacZ reporter gene (nuclear localization) were injected into the m. gastrocnemius of mdx mice. At 10 d after injection, we detected many lacZ+ cells in the transplanted muscle (a-1). In the injected area, a vessel-like structure containing lacZ+ nuclei was also found (a-2, arrowheads). Some peripheral nerve–like structures (a-3, arrowheads) with lacZ+ nuclei (a-3, arrow) were also found in the injected site. (b) At 25 d after transplantation, we observed some lacZ+ nuclei (b-1, arrow) in the endothelium of well-differentiated blood vessels (b-1, star), which was confirmed by vWF staining in adjacent sections (b-2, star). (c) LacZ+ nuclei (arrow) were also found in well- differentiated peripheral nerves in the injected skeletal muscle at 25 d after transplantation. (d) Colocalization of β-galactosidase, vWF, and Hoechst by immunochemistry revealed β-galactosidase+ nuclei (d-1, green, arrowhead) in vWF+ structure (d-1, red) and costained with Hoechst (d-2 and d-3, arrowhead). (e) After transplantation of MDSC isolated from GFP transgenic mice, some peripheral nerve structures expressing CNPase immunoreactivity, a Schwann cell marker (e-1, red), were colocalized with GFP-expressing cells (e-2) and Hoechst (e-3) in the transplanted mdx TA muscle. Triple exposure of CNPase, GFP, and Hoechst (blue) is shown in e-3. Bars: (a-1) 500 μm; (b, c, and e) 50 μm; (d) 25 μm.
Figure 7.
Figure 7.
Isolation of three populations of muscle-derived cells. Muscle-derived cells were enzymatically dissociated from neonatal mouse skeletal muscle and separated by their adhesion characteristics to collagen-coated flasks (modified preplate technique). After the enzymatic dissociation, the muscle cell extract was resuspended in PM and preplated on collagen-coated flasks. Different populations of muscle-derived cells were isolated based on adhesion characteristics. pp1 represented a population of primary fibroblasts that adhered in the first 2 h after isolation; subsequent preplates, containing a mixture of myogenic and nonmyogenic cells, were obtained at 24-h intervals (pp2–6). The nonmyogenic cells in pp2 and pp3 were removed from the cultures by replating the cells, and the resulting enriched pp2 and pp3 desmin+ cells were combined with pp4 and pp5 cells and were termed the EP population. Cells in the pp6 cell population took an additional 24–72 h to attach to collagen-coated dishes after transfer from pp5 and were termed LP cells. Most of the LP cells died during the first 1–2 wk of the cultivation period, with very few of the adherent surviving cells proliferating and forming clonal colonies. The surviving clones are called MDSC. We also isolated subclones from a single clone of MDSC, as shown in the flow chart.

References

    1. Baroffio, A., M. Hamann, L. Bernheim, M.L. Bochaton-Piallat, G. Gabbiani, and C.R. Bader. 1996. Identification of self-renewing myoblasts in the progeny of single human muscle satellite cells. Differentiation. 60:47–57. - PubMed
    1. Barch, M.J. 1991. Chromosome analysis. The ACT Cytogenetics Laboratory Manual. 2nd ed. Raven Press, Ltd., New York. 349.
    1. Beauchamp, J.R., J.E. Morgan, C.N. Pagel, and T.A. Partridge. 1999. Dynamics of myoblast transplantation reveal a discrete minority of precursors with stem cell–like properties as the myogenic source. J. Cell Biol. 144:1113–1122. - PMC - PubMed
    1. Beauchamp, J.R., L. Heslop, D.S. Yu, S. Tajbakhsh, R.G. Kelly, A. Wernig, M.E. Buckingham, T.A. Partridge, and P.S. Zammit. 2000. Expression of CD34 and Myf5 defines the majority of quiescent adult skeletal muscle satellite cells. J. Cell Biol. 151:1221–1234. - PMC - PubMed
    1. Bischoff, R. 1986. Proliferation of muscle satellite cells on intact myofibers in culture. Dev. Biol. 115:129–139. - PubMed

Publication types

MeSH terms