. 2002 May 20;195(10):1303-16.
doi: 10.1084/jem.20011624.

Induction of lymphocyte apoptosis by tumor cell secretion of FasL-bearing microvesicles

Affiliations

Induction of lymphocyte apoptosis by tumor cell secretion of FasL-bearing microvesicles

Giovanna Andreola et al. J Exp Med. .

Abstract

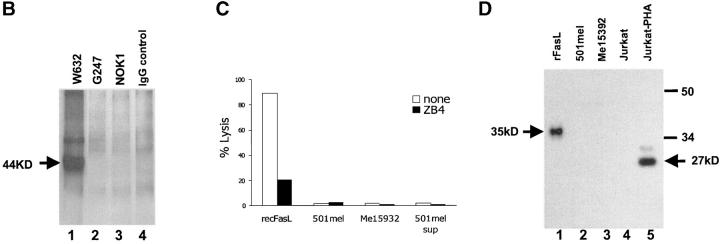
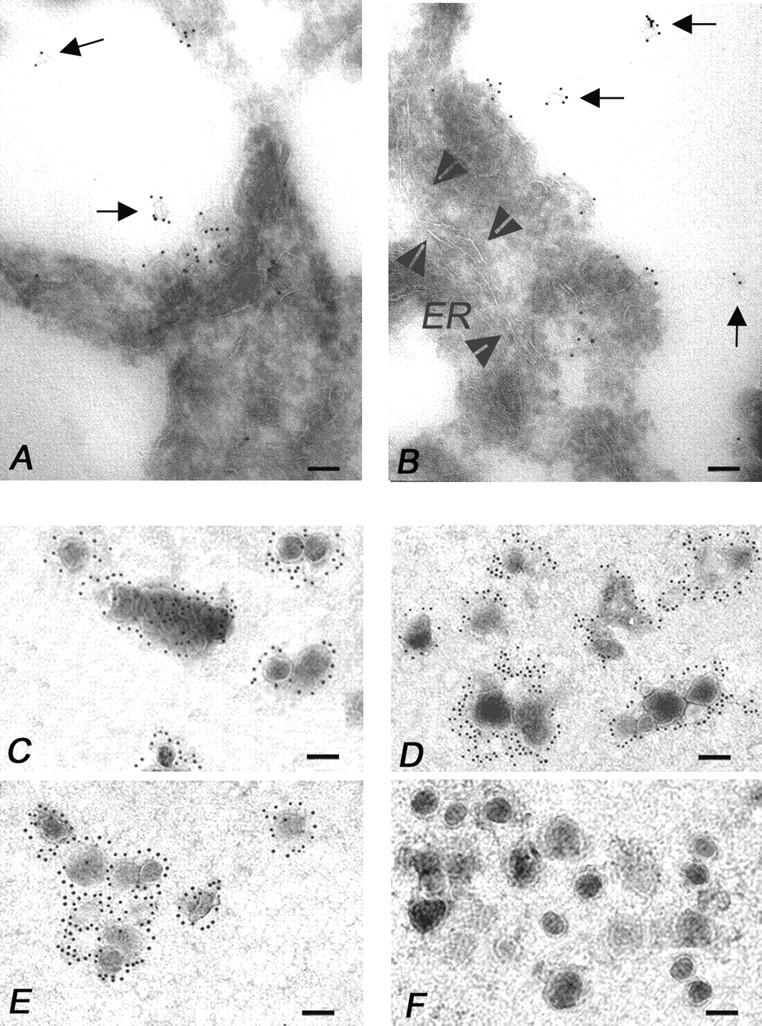
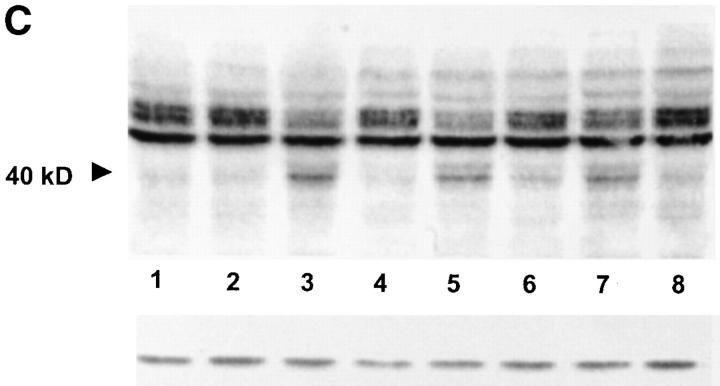
The hypothesis that FasL expression by tumor cells may impair the in vivo efficacy of antitumor immune responses, through a mechanism known as 'Fas tumor counterattack,' has been recently questioned, becoming the object of an intense debate based on conflicting results. Here we definitely show that FasL is indeed detectable in the cytoplasm of melanoma cells and its expression is confined to multivesicular bodies that contain melanosomes. In these structures FasL colocalizes with both melanosomal (i.e., gp100) and lysosomal (i.e., CD63) antigens. Isolated melanosomes express FasL, as detected by Western blot and cytofluorimetry, and they can exert Fas-mediated apoptosis in Jurkat cells. We additionally show that melanosome-containing multivesicular bodies degranulate extracellularly and release FasL-bearing microvesicles, that coexpress both gp100 and CD63 and retain their functional activity in triggering Fas-dependent apoptosis of lymphoid cells. Hence our data provide evidence for a novel mechanism potentially operating in Fas tumor counterattack through the secretion of subcellular particles expressing functional FasL. Such vesicles may form a sort of front line hindering lymphocytes and other immunocompetent cells from entering neoplastic lesions and exert their antitumor activity.


Figures

Figure 1.
Figure 1.
FasL cannot be detected on melanoma cell membrane and in culture supernatant. (A) Cytofluorimetric analysis. Melanoma and transiently FasL-gene transfected 293 cells (control) were stained with anti-FasL NOK-1 mAb (dark area), or with an isotype-matched IgG (clear area), after 24 h-treatment with KB8301 10 μM; fluorescence was analyzed by FACSCalibur™ and CELLQuest™ software; data refer to three representative melanoma lines, from a panel of 10 tested. (B) Immunoprecipitation of membrane proteins: cell surface biotin-labeled cells of Me15392 were immunoprecipitated with G247 (lane 2) and NOK-1 (lane 3) anti-FasL mAb, with the isotype-matched murine IgG1 negative control (lane 4), or with the anti–HLA-class I mAb W6.32, as positive control. Cell lysates were analyzed in Western blot analysis with Streptavidin-HPR. A specific band (44 kD) is detectable only in lysates immunoprecipitated with W6.32 (lane 1). (C) Proapoptotic activity of melanoma cells. 51[Cr]-labeled Jurkat cells (at 103cells per well), in the presence or absence of neutralizing anti-Fas mAb ZB4 (50 ng/ml), were incubated for 16 h with either melanoma cells (105cells per well), rFasL (100 ng/ml), or concentrated supernatant from 501mel culture (dilution 1:2). Killing was calculated as percentage of lysis. (D) Western blot analysis of FasL expression in supernatants from melanoma cell cultures. Melanoma supernantants were harvested from 72 h confluent cell cultures and concentrated by Centricon filter devices (cut-off 50 kD) (lanes 2 and 3). Concentrated supernatant from resting (lane 4) or PHA-activated (lane 5) Jurkat cells were additionally used as negative and positive controls, respectively. rFasL was also included (lane 1). Western blot analysis was stained with the anti-FasL G247 mAb. A 27-kD band, corresponding to soluble FasL, could be detected in supernatant from PHA-activated Jurkat cells.
Figure 1.
Figure 1.
FasL cannot be detected on melanoma cell membrane and in culture supernatant. (A) Cytofluorimetric analysis. Melanoma and transiently FasL-gene transfected 293 cells (control) were stained with anti-FasL NOK-1 mAb (dark area), or with an isotype-matched IgG (clear area), after 24 h-treatment with KB8301 10 μM; fluorescence was analyzed by FACSCalibur™ and CELLQuest™ software; data refer to three representative melanoma lines, from a panel of 10 tested. (B) Immunoprecipitation of membrane proteins: cell surface biotin-labeled cells of Me15392 were immunoprecipitated with G247 (lane 2) and NOK-1 (lane 3) anti-FasL mAb, with the isotype-matched murine IgG1 negative control (lane 4), or with the anti–HLA-class I mAb W6.32, as positive control. Cell lysates were analyzed in Western blot analysis with Streptavidin-HPR. A specific band (44 kD) is detectable only in lysates immunoprecipitated with W6.32 (lane 1). (C) Proapoptotic activity of melanoma cells. 51[Cr]-labeled Jurkat cells (at 103cells per well), in the presence or absence of neutralizing anti-Fas mAb ZB4 (50 ng/ml), were incubated for 16 h with either melanoma cells (105cells per well), rFasL (100 ng/ml), or concentrated supernatant from 501mel culture (dilution 1:2). Killing was calculated as percentage of lysis. (D) Western blot analysis of FasL expression in supernatants from melanoma cell cultures. Melanoma supernantants were harvested from 72 h confluent cell cultures and concentrated by Centricon filter devices (cut-off 50 kD) (lanes 2 and 3). Concentrated supernatant from resting (lane 4) or PHA-activated (lane 5) Jurkat cells were additionally used as negative and positive controls, respectively. rFasL was also included (lane 1). Western blot analysis was stained with the anti-FasL G247 mAb. A 27-kD band, corresponding to soluble FasL, could be detected in supernatant from PHA-activated Jurkat cells.
Figure 2.
Figure 2.
Immunocytochemical analysis of FasL expression in human melanoma cells. FasL expression in three representative melanoma lines (Me15392, 501mel, and Me30966, in A, B, and C, respectively), from a panel of 10 tested, is shown. Note (i) the striking localization of the FasL staining on well-defined cytoplasmic vesicles and (ii) the differential quantitative expression among the three cell lines. Immunophenotyping of fixed cells was performed using the PAP method. AEC was used as chromogen and Mayer's haematoxylin for the counterstaining. Original magnification: 2,500×.
Figure 3.
Figure 3.
FasL intracellular localization in melanoma cells. (A) Cytofluorimetric analysis: melanoma cells were permeabilized with 70% methanol for 5 min on ice and subsequently stained with the anti-FasL G247 mAb (dark area) or with an isotype-matched IgG (clear area). Fluorescence was analyzed by FACSCalibur™ and CELLQuest™ software; data refer to three representative melanoma lines, from a panel of 10 tested. (B and C) Western blot detection of FasL in melanoma total cell lysates. Melanoma or PHA-activated Jurkat total cell lysates were stained by the anti-FasL G247 mAb. A significant positivity was detected in melanoma cell lysates (panel B, lanes 2–3), resembling the pattern observed in PHA-activated Jurkat cells (panel C, lane 2). Three major bands were detected in both melanoma and Jurkat cell lysates, corresponding to a molecular weight ranging between 40 and 33 kD and likely representing differently glycosylated forms of FasL molecule. (D) Western blot detection of FasL in cytoplasmic fractions of melanoma cells. Cytoplasmic-enriched preparations from melanoma cells were obtained as described in Materials and Methods. Western blot was stained with G247 mAb. Significant positivity (with bands ranging between 40 and 33 kD, with a predominance of the 40-kD band) was observed in both melanoma lines (lanes 2 and 3).
Figure 3.
Figure 3.
FasL intracellular localization in melanoma cells. (A) Cytofluorimetric analysis: melanoma cells were permeabilized with 70% methanol for 5 min on ice and subsequently stained with the anti-FasL G247 mAb (dark area) or with an isotype-matched IgG (clear area). Fluorescence was analyzed by FACSCalibur™ and CELLQuest™ software; data refer to three representative melanoma lines, from a panel of 10 tested. (B and C) Western blot detection of FasL in melanoma total cell lysates. Melanoma or PHA-activated Jurkat total cell lysates were stained by the anti-FasL G247 mAb. A significant positivity was detected in melanoma cell lysates (panel B, lanes 2–3), resembling the pattern observed in PHA-activated Jurkat cells (panel C, lane 2). Three major bands were detected in both melanoma and Jurkat cell lysates, corresponding to a molecular weight ranging between 40 and 33 kD and likely representing differently glycosylated forms of FasL molecule. (D) Western blot detection of FasL in cytoplasmic fractions of melanoma cells. Cytoplasmic-enriched preparations from melanoma cells were obtained as described in Materials and Methods. Western blot was stained with G247 mAb. Significant positivity (with bands ranging between 40 and 33 kD, with a predominance of the 40-kD band) was observed in both melanoma lines (lanes 2 and 3).
Figure 4.
Figure 4.
Immunoelectron microscopic analysis of FasL expression in human melanoma cells. (A and B) Immunoelectron microscopy obtained by Lowicryl HM20 resin embedment (see Materials and Methods) of melanoma cells (bars, 1 μm). (A) A multivesicular body containing melanosomes at different state of maturation labeled for FasL. (B) Magnification of the squared area in A, showing the specific FasL labeling on light and dark organelles corresponding to early (low melanin levels) and late (high melanin levels) melanosome differentation state, respectively. (C–F) Immunoelectron microscopy pictures obtained by ultrathin cryosections of melanoma cells (see Materials and Methods) (bars, 0.1 μm). (C) Double immunolabeling of FasL (large golds, 20 nm; arrow) and CD63 (small golds, 10 nm; arrowhead); (D) of FasL (large golds, 20 nm; arrow) and gp100 (small golds, 10 nm; arrowhead); small arrowheads indicate the ER free of gold particle staining; (E) double immunolabeling of CD63 (large golds, 20 nm; arrow) and gp100 (small golds, 10 nm; arrowhead); (F) higher magnification of a multivesicular body double stained for FasL (large golds, 20 nm; arrow) and gp100 (small golds, 10 nm; arrowhead).
Figure 5.
Figure 5.
FasL expression in melanosomes purified from melanoma cells. (A) Western blot analysis of purified melanosome preparations. Western blot analysis was performed using proteins derived from melanosomal preparations purified from melanoma lines by sucrose gradient. Staining with G247 mAb revealed the presence in melanosome preparations of the 40–33 kD band pattern (lane 3–5). (B) Purity controls of melanosome preparations. Controls performed to check purity of melanosome preparations revealed the expression of the melanosomal marker gp100, and no significant contamination with Golgi, mitochondria, or plasma-membrane markers. The ER marker Bip/GRP78 was detectable in melanosome preparations. (C) Cytofluorimetric analysis of FasL expression on purified melanosomes. Melanosomes were stained with anti-FasL NOK-1, anti-gp100, anti LAMP-2, and anti-CD63 mAbs, followed by incubation with FITC goat anti–mouse IgG (dark areas); an irrelevant isotype-matched Ab plus the FITC-conjugated goat anti–mouse IgG were used as negative control (clear areas). Fluorescence was analyzed by FACSCalibur™ and CELLQuest™ software. Melanosomes were detected as granules of the approximate mean size of 1 μm, relative to standard beads of 6 μm size.
Figure 6.
Figure 6.
Induction of Fas-mediated apoptosis by purified melanosomes. (A) Jurkat cells were incubated overnight in the presence of rFasL (100 ng/ml), or different doses of melanosomes (total protein concentration: 0.35 mg/ml), purified from 501mel melanoma line as described in Materials and Methods. Cells were incubated alone or after treatment with ZB4 mAb (50 ng/ml) and harvested 18 h later. Apoptosis was then evaluated by propidium and annexin staining and FACS®analysis and expressed as percentage of apoptotic cells. (B) Jurkat cells were pretreated with different concentrations of ZB4 and incubated with 100 μl per well melanosomes. Apoptosis was then evaluated by propidium and annexin staining and FACS®analysis.
Figure 7.
Figure 7.
Immunocytochemical analysis of MVs released by melanoma cells. (A) A cluster of human melanoma cells adherent on glass chamber slides, showing a high level of FasL expression (as detected by G247 mAb), polarized on cellular filopodia and interdigitations (arrowheads). (B) Higher magnification of the FasL stainings on the tip of a melanoma cell interdigitation, showing both the unidirectional secretory behavior (arrowhead) and the marked polar concentration (arrow) of the FasL staining. (C) High electronic magnification of a defined field of a melanoma cell where a cluster of FasL-positive vesicles is under degranulation and a group of three isolated FasL-positive vesicles is detectable 8–10 μm away from the cell membrane (arrow). Immunophenotyping of fixed cells was performed using the PAP method; AEC was used as chromogen and Mayer's haematoxylin for the counterstaining. Final original magnifications: (A) 1,000×; (B) 2,500×; and (C) 3,000×.
Figure 8.
Figure 8.
Immunoelectron microscopy analysis of multivesicular bodies, secretory vesicles, and isolated MVs from melanoma cells. (A and B) Immunoelectron microscopy on ultrathin cryosections of human melanoma cells (see Materials and Methods). (A) Note the clear FasL immunolabeling of exosome-like particles (arrows) degranulating in the extracellular environment by a multivesicular body. In B, multiple degranulation sites are shown with FasL immunolabeled exosome-like vesicles (arrows) scattered into the extracellular environment. Arrowheads outline a wide ER vesicle (ER) that appears negative for the FasL immunolabeling. (C–F) Electron microscopy of the 100,000 g pellet immunogold labeled for (C) FasL, (D) CD63, (E) gp100, and (F) Golgi, respectively. The pellet was composed of 100–200 nm MVs, often detected as aggregates, showing abundant FasL, CD63, and gp100 immunolabeling, while they do not stain for Golgi markers (bars, 0.1 μm).
Figure 9.
Figure 9.
FasL expression on MVs purified from melanoma cell supernatant. (A) Western blot analysis. Analysis of MVs isolated from melanoma cell supernatant by serial ultracentrifugations, as performed by Western blot and staining with G247 mAb. An ∼35-kD band can be observed in MVs from melanoma lines (lanes 4, 6, and 7), resembling the one observed in MVs from PHA-activated Jurkat cells (lane 2). Only MV from PHA-activated, and not from resting Jurkat cells (lane 3) showed positivity for FasL, suggesting that this molecule unlikely derived from FBS used for cell culture. (B) Purity controls of microvesicle preparations. Controls performed to check purity of microvesicle preparations from melanoma cell supernatant revealed the expression of the melanosomal marker gp100, and no significant contamination with Golgi, ER, or mitochondria. (C) Cytofluorimetric analysis of FasL expression on purified MVs. MVs from 501mel line were stained with anti-FasL NOK-1, anti-gp100, anti–LAMP-2, and anti-CD63 mAbs, followed by incubation with FITC goat anti–mouse IgG (dark areas); an irrelevant isotype-matched Ab plus the FITC-conjugated goat anti–mouse IgG were used as negative control (clear areas). Fluorescence was analyzed by FACSCalibur™ and CELLQuest™ software. MVs were detected as granules with a size range of 100–600 nm, relative to standard beads of 6 μm size.
Figure 9.
Figure 9.
FasL expression on MVs purified from melanoma cell supernatant. (A) Western blot analysis. Analysis of MVs isolated from melanoma cell supernatant by serial ultracentrifugations, as performed by Western blot and staining with G247 mAb. An ∼35-kD band can be observed in MVs from melanoma lines (lanes 4, 6, and 7), resembling the one observed in MVs from PHA-activated Jurkat cells (lane 2). Only MV from PHA-activated, and not from resting Jurkat cells (lane 3) showed positivity for FasL, suggesting that this molecule unlikely derived from FBS used for cell culture. (B) Purity controls of microvesicle preparations. Controls performed to check purity of microvesicle preparations from melanoma cell supernatant revealed the expression of the melanosomal marker gp100, and no significant contamination with Golgi, ER, or mitochondria. (C) Cytofluorimetric analysis of FasL expression on purified MVs. MVs from 501mel line were stained with anti-FasL NOK-1, anti-gp100, anti–LAMP-2, and anti-CD63 mAbs, followed by incubation with FITC goat anti–mouse IgG (dark areas); an irrelevant isotype-matched Ab plus the FITC-conjugated goat anti–mouse IgG were used as negative control (clear areas). Fluorescence was analyzed by FACSCalibur™ and CELLQuest™ software. MVs were detected as granules with a size range of 100–600 nm, relative to standard beads of 6 μm size.
Figure 10.
Figure 10.
Apoptotic activity of MVs isolated from melanoma cell supernatant. (A) Jurkat cells were incubated overnight in the presence of rFasL (100 ng/ml), or 50 μl/ml MVs isolated from resting Jurkat cells, PHA-activated Jurkat cells or 501mel cells, purified as described in Materials and Methods (protein concentrations: 13.3, 15, and 5.1 mg/ml, respectively). Target cells were used with or without pretreatment with ZB4 mAb (50 ng/ml) and harvested 18 h later. Evaluation of apoptosis induction as detected by FACS® analysis for propidium and annexin staining. (B) Jurkat cells were pretreated with different concentrations of ZB4 and incubated with rFasL (100 ng/ml) or 50 μl per well MVs from 501mel line. Apoptosis was then evaluated by propidium and annexin staining and FACS®analysis. (C) Western blot analysis of caspase-8 cleavage. Control loading is shown by actin. Jurkat cells, with (Jurkat/ZB4) or without preexposure to ZB4 mAb (50 ng/ml), were incubated overnight with different apoptotic stimuli: lane 1, Jurkat; 2, Jurkat/ZB4; 3, Jurkat + rFasL (100 ng/ml); 4, Jurkat/ZB4 plus rFasL; 5, Jurkat plus melanosomes (100 μl/ml, protein concentration 3.5 mg/ml); 6, Jurkat/ZB4 plus melanosomes; 7, Jurkat plus 501mel MVs (50 μl/ml, protein concentration 5.1 mg/ml); Jurkat/ZB4 plus 501mel MVs. Induction of apoptosis was detected as a 40-kD band, representing the cleaved activated form of activated caspase-8. No band is detectable when Jurkat cells were pretreated with ZB4.
Figure 10.
Figure 10.
Apoptotic activity of MVs isolated from melanoma cell supernatant. (A) Jurkat cells were incubated overnight in the presence of rFasL (100 ng/ml), or 50 μl/ml MVs isolated from resting Jurkat cells, PHA-activated Jurkat cells or 501mel cells, purified as described in Materials and Methods (protein concentrations: 13.3, 15, and 5.1 mg/ml, respectively). Target cells were used with or without pretreatment with ZB4 mAb (50 ng/ml) and harvested 18 h later. Evaluation of apoptosis induction as detected by FACS® analysis for propidium and annexin staining. (B) Jurkat cells were pretreated with different concentrations of ZB4 and incubated with rFasL (100 ng/ml) or 50 μl per well MVs from 501mel line. Apoptosis was then evaluated by propidium and annexin staining and FACS®analysis. (C) Western blot analysis of caspase-8 cleavage. Control loading is shown by actin. Jurkat cells, with (Jurkat/ZB4) or without preexposure to ZB4 mAb (50 ng/ml), were incubated overnight with different apoptotic stimuli: lane 1, Jurkat; 2, Jurkat/ZB4; 3, Jurkat + rFasL (100 ng/ml); 4, Jurkat/ZB4 plus rFasL; 5, Jurkat plus melanosomes (100 μl/ml, protein concentration 3.5 mg/ml); 6, Jurkat/ZB4 plus melanosomes; 7, Jurkat plus 501mel MVs (50 μl/ml, protein concentration 5.1 mg/ml); Jurkat/ZB4 plus 501mel MVs. Induction of apoptosis was detected as a 40-kD band, representing the cleaved activated form of activated caspase-8. No band is detectable when Jurkat cells were pretreated with ZB4.

Similar articles

Cited by

References

    1. Marincola, F.M., E.M. Jaffee, D.J. Hicklin, and S. Ferrone. 2000. Escape of human solid tumors from T-cell recognition: molecular mechanisms and significance. Adv. Immunol. 74:181–273. - PubMed
    1. Hahne, M., D. Rimoldi, M. Schroter, P. Romero, M. Schreier, L.E. French, P. Schneider, T. Bornand, A. Fontana, D. Lienard, et al. 1996. Melanoma cell expression of Fas(Apo-1/CD95) ligand: implications for tumor immune escape. Science. 274:1363–1366. - PubMed
    1. O'Connell, J., M.W. Bennett, G.C. O' Sullivan, J.K. Collins, and F. Shanahan. 1999. The Fas counterattack: cancer as a site of immune privilege. Immunol. Today. 20:46–52. - PubMed
    1. Siegel, R.M., F.K. Chan, H.J. Chun, and M.J. Lenardo. 2000. The multifaceted role of Fas signaling in immune cell homeostasis and autoimmunity. Nat. Immunol. 1:469–474. - PubMed
    1. Reimer, T., C. Herrnring, D. Koczan, D. Richter, B. Gerber, D. Kabelitz, K. Friese, and H.J. Thiesen. 2000. FasL:Fas ratio - a prognostic factor in breast carcinomas. Cancer Res. 60:822-828. - PubMed

Publication types

MeSH terms