. 2002 Jun;76(12):6244-56.
doi: 10.1128/jvi.76.12.6244-6256.2002.

Gammaherpesvirus lytic gene expression as characterized by DNA array

Affiliations

Gammaherpesvirus lytic gene expression as characterized by DNA array

Joo Wook Ahn et al. J Virol. 2002 Jun.

Abstract

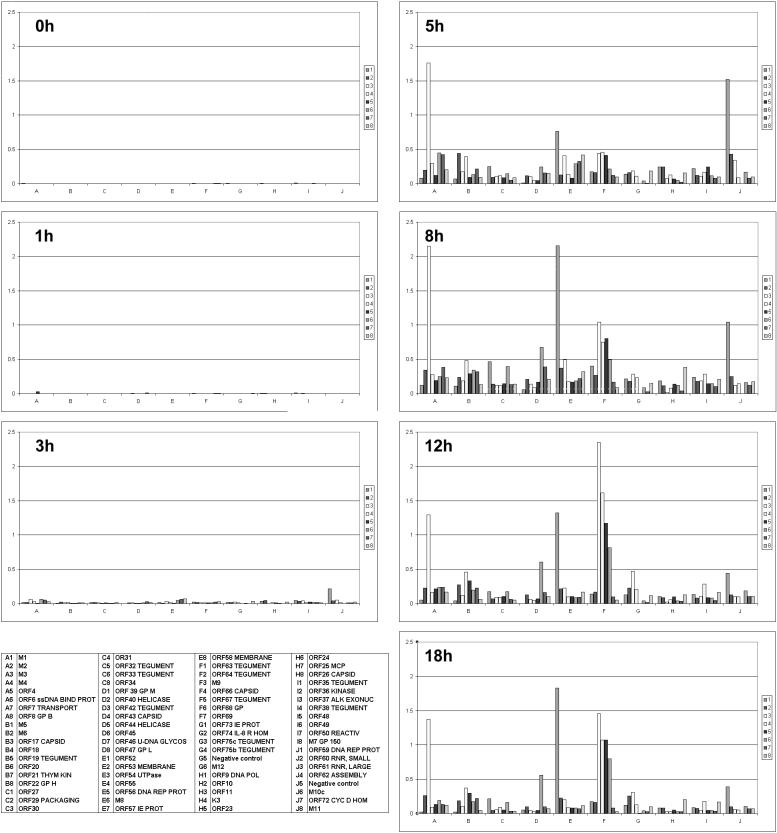
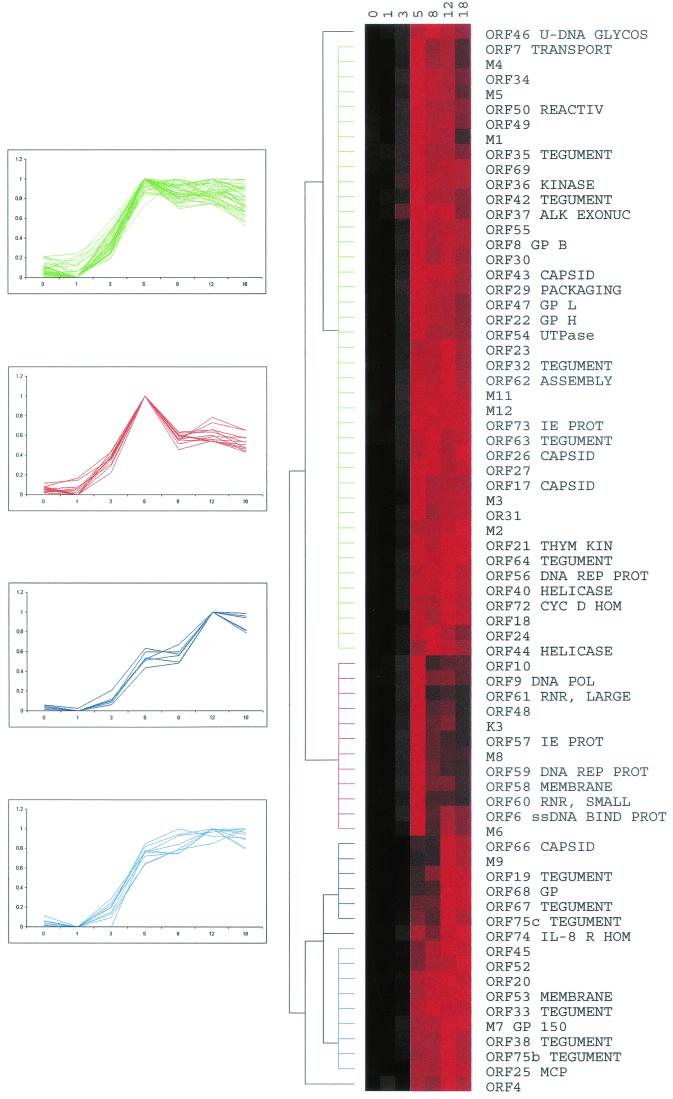
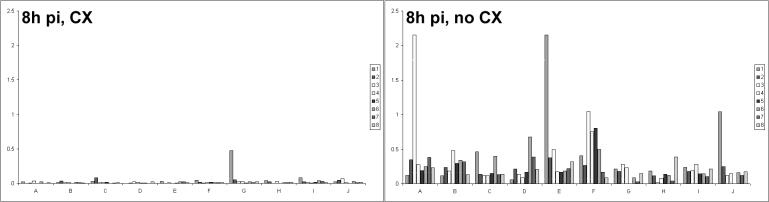
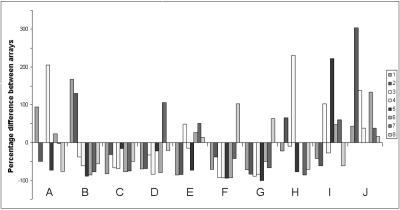
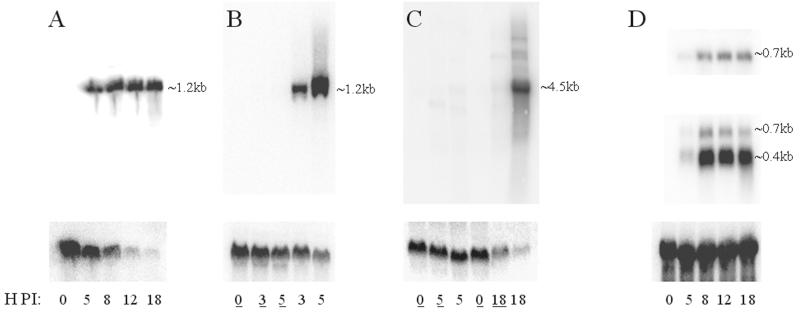
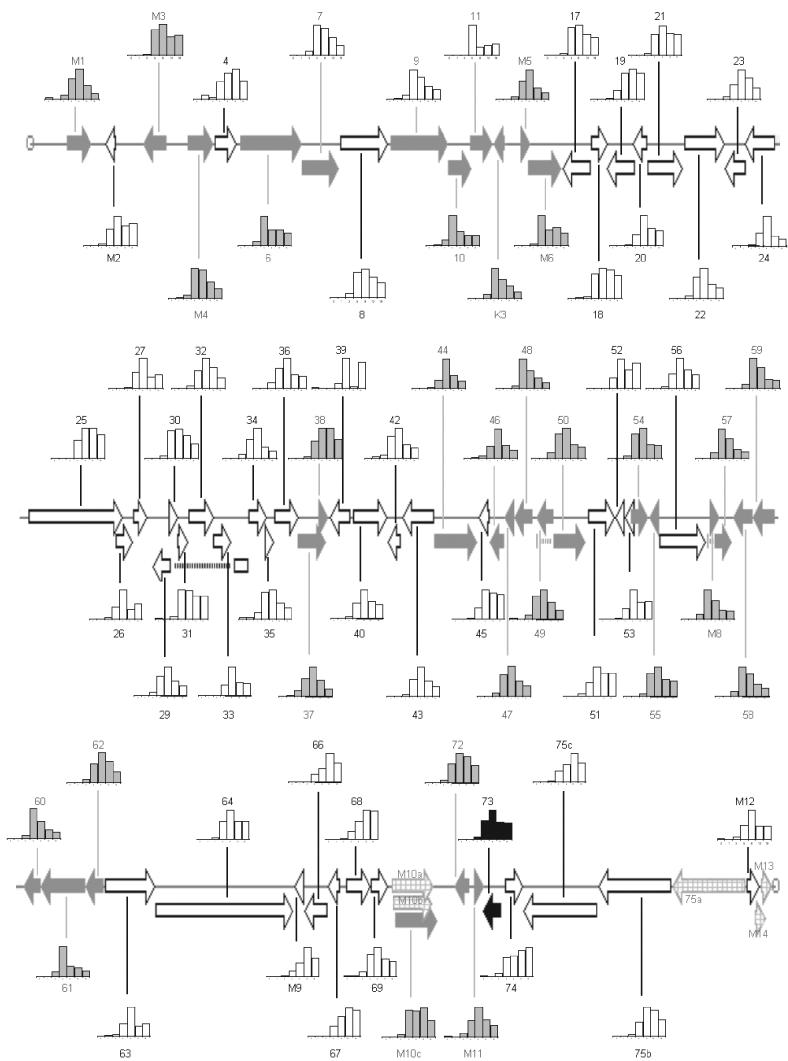
Gammaherpesviruses are associated with a number of diseases including lymphomas and other malignancies. Murine gammaherpesvirus 68 (MHV-68) constitutes the most amenable animal model for this family of pathogens. However experimental characterization of gammaherpesvirus gene expression, at either the protein or RNA level, lags behind that of other, better-studied alpha- and beta-herpesviruses. We have developed a cDNA array to globally characterize MHV-68 gene expression profiles, thus providing an experimental supplement to a genome that is chiefly annotated by homology. Viral genes started to be transcribed as early as 3 h postinfection (p.i.), and this was followed by a rapid escalation of gene expression that could be seen at 5 h p.i. Individual genes showed their own transcription profiles, and most genes were still being expressed at 18 h p.i. Open reading frames (ORFs) M3 (chemokine-binding protein), 52, and M9 (capsid protein) were particularly noticeable due to their very high levels of expression. Hierarchical cluster analysis of transcription profiles revealed four main groups of genes and allowed functional predictions to be made by comparing expression profiles of uncharacterized genes to those of genes of known function. Each gene was also categorized according to kinetic class by blocking de novo protein synthesis and viral DNA replication in vitro. One gene, ORF 73, was found to be expressed with alpha-kinetics, 30 genes were found to be expressed with beta-kinetics, and 42 genes were found to be expressed with gamma-kinetics. This fundamental characterization furthers the development of this model and provides an experimental basis for continued investigation of gammaherpesvirus pathology.


Figures

FIG. 1.
FIG. 1.
Scatter plots of array data. (A) Background-subtracted data from two repeated arrays (time point, 5 h p.i.) were plotted against each other. Linear regression analysis gives a line of gradient 0.80 (r = 0.76). (B) The data from the array in panel A were subjected to normalization via the internal control, and these normalized data were plotted against each other. Linear regression analysis gives a line of gradient 0.99 (r = 0.94). (C) Reproducibility of arrays was assessed by plotting four repeated arrays (time point, 5 h p.i.) against each other in all combinations. Linear regression analysis gives a line of gradient 1.01 (r = 0.91).
FIG. 2.
FIG. 2.
Array analysis of MHV-68 gene expression. NIH 3T3 cells were infected and harvested for isolation of RNA at various time points p.i. RNA was reverse transcribed to produce radiolabeled cDNAs that were hybridized to arrays. Bar charts represent the global profile of gene expression at various times p.i. as indicated. Each chart is based on mean values of independent experiments (duplicates; n = 2 to 6), normalized to internal controls. The identity of each bar is given in the key. Abbreviations are as follows: ssDNA BIND PROT, single-stranded DNA binding protein; GP B, glycoprotein B; THYM KIN, thymidine kinase; U-DNA GLYCOS, uracil DNA glycosylase; DNA REP PROT, DNA replication protein; IE PROT, immediate-early protein; IL-8 R HOM, interleukin-8 receptor homologue; DNA POL, DNA polymerase; MCP, major capsid protein; ALK EXONUC, alkaline exonuclease; REACTIV, transcriptional activator; GP150, glycoprotein 150; RNR, ribonucleotide reductase; CYC D HOM, cyclin D homologue.
FIG. 3.
FIG. 3.
Hierarchical cluster analysis of MHV-68 expression profiles. Data in the form of log2 normalized means (duplicates; n = 2 to 6) were converted into a percentage of each gene's maximum. These percentages were imported into Cluster software, and hierarchical clustering was performed using the average-linkage algorithm and an uncentered correlation similarity matrix. The data are shown as a color matrix with columns representing time points p.i. and rows representing each gene's expression profile. Black boxes, no expression; brighter shades of red, increasing expression. The dendrogram shows related expression profiles on the same branch, with branch lengths representing the degree of similarity between individual profiles. Line graphs of clustered genes are shown to the left, with the color of each line graph corresponding to the dendrogram branch of the same color. Abbreviations are defined in the legend for Fig. 2.
FIG. 4.
FIG. 4.
Incorporation of radiolabeled methionine into protein by NIH 3T3 cells in the presence of CX. NIH 3T3 cell monolayers were pretreated with various concentrations of CX before introduction of radiolabeled methionine into the medium. Cells were harvested after 8 h, and the level of methionine incorporation was measured. y axis, percent incorporation of labeled methionine relative to that for uninhibited controls; x axis, concentration of CX present in cell medium.
FIG. 5.
FIG. 5.
MHV-68 gene expression in the absence of de novo protein synthesis. NIH 3T3 cells were infected with or without CX inhibition. RNA was isolated from cells harvested 8 h p.i. and used to produce radiolabeled cDNAs, which were hybridized to arrays. (Left) Array analysis of gene expression with a 95% protein synthesis block. (Right) Gene expression in a control, uninhibited infection. The identity of each bar is as given in the key of Fig. 2.
FIG. 6.
FIG. 6.
Relative expression of MHV-68 genes in the absence of viral DNA replication. NIH 3T3 cells were infected with or without inhibition of viral DNA replication. RNA was isolated from cells harvested 18 h p.i. and used to produce radiolabeled cDNAs that were hybridized to arrays. Array data from an uninhibited infection were subtracted from data for a viral DNA replication-inhibited infection (n = 4). y axis, percent difference in expression between inhibited and uninhibited infections. Negative values represent percent reduction in signals following inhibition and vice versa. Genes that were down-regulated by more than 2 measures of standard deviation were classified as γ genes. The identity of each bar is as given in the key of Fig. 2.
FIG. 7.
FIG. 7.
Northern blot analysis of MHV-68 transcripts. NIH 3T3 cells were infected and harvested for isolation of RNA at various time points p.i. The RNA was run out on a denaturing gel and blotted onto nylon membranes. Radiolabeled probes specific for various transcripts (see Materials and Methods) were hybridized to the membranes. The time p.i. when cells were taken for RNA isolation is indicated at the bottom of each lane. An underlined number indicates the presence of a metabolic inhibitor. Approximate sizes of transcripts are indicated to the right of each panel. Control hybridizations are shown below the viral transcript hybridizations. (A) ORF M3-specific probe (top). β-Actin (bottom) is reduced following infection. (B) ORF M3-specific probe (top). Underlined time points indicate presence of CX. Again β-actin (bottom) shows reduced expression following infection. (C) ORF 67-specific probe (top). Underlined time points indicate presence of 4′-S-EtdU. Bottom, β-actin. (D) ORF 53-specific (top), ORF 52-specific (middle), and luciferase-specific (bottom) probes. Note that the same blot was used for panels A and D.
FIG. 8.
FIG. 8.
Map of MHV-68 transcriptional profiles as produced by array analysis. The expression profiles for MHV-68 were placed onto a physical map of the virus. Genes are color coded according to their expression kinetics: black arrows, α-class genes; white arrows, γ-class genes; grey arrows, remaining set of genes; checked arrows, genes not included on the array. Transcriptional profiles normalized to maximal expression for each gene are shown as bar charts.

References

    1. Adler, H., M. Messerle, M. Wagner, and U. H. Koszinowski. 2000. Cloning and mutagenesis of the murine gammaherpesvirus 68 genome as an infectious bacterial artificial chromosome. J. Virol. 74:6964-6974. - PMC - PubMed
    1. Alber, D. G., K. L. Powell, P. Vallance, D. A. Goodwin, and C. Grahame-Clarke. 2000. Herpesvirus infection accelerates atherosclerosis in the apolipoprotein E-deficient mouse. Circulation 102:779-785. - PubMed
    1. Barnes, A., H. Dyson, N. P. Sunil-Chandra, P. Collins, and A. A. Nash. 1999. 2′-Deoxy-5-ethyl-beta-4′-thiouridine inhibits replication of murine gammaherpesvirus and delays the onset of virus latency. Antivir. Chem. Chemother. 10:321-326. - PubMed
    1. Belz, G. T., and P. C. Doherty. 2001. Virus-specific and bystander CD8+ T-cell proliferation in the acute and persistent phases of a gammaherpesvirus infection. J. Virol. 75:4435-4438. - PMC - PubMed
    1. Bornkamm, G. W., and W. Hammerschmidt. 2001. Molecular virology of Epstein-Barr virus. Philos. Trans. R. Soc. Lond. B Biol. Sci. 356:437-459. - PMC - PubMed

Publication types

LinkOut - more resources