

Ozone differentially modulates airway responsiveness in atopic versus nonatopic guinea pigs
- PMID: 12028802
- PMCID: PMC2978653
- DOI: 10.1080/089583701753678562
Ozone differentially modulates airway responsiveness in atopic versus nonatopic guinea pigs
Abstract
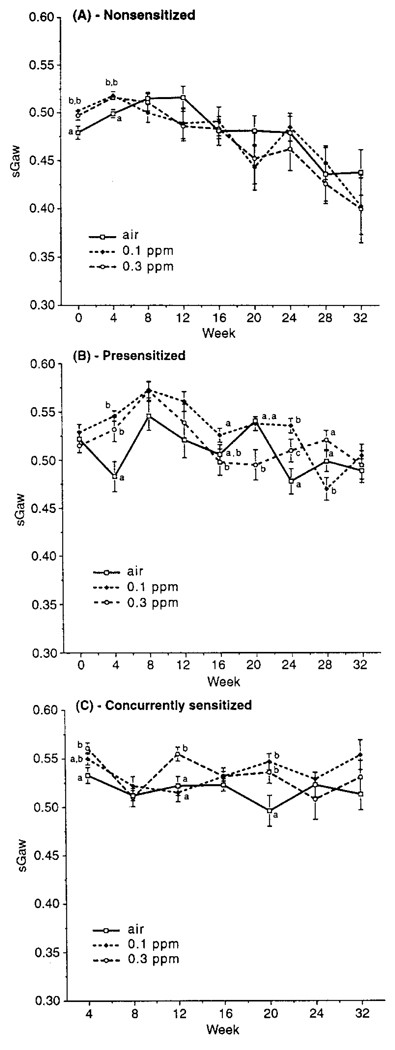
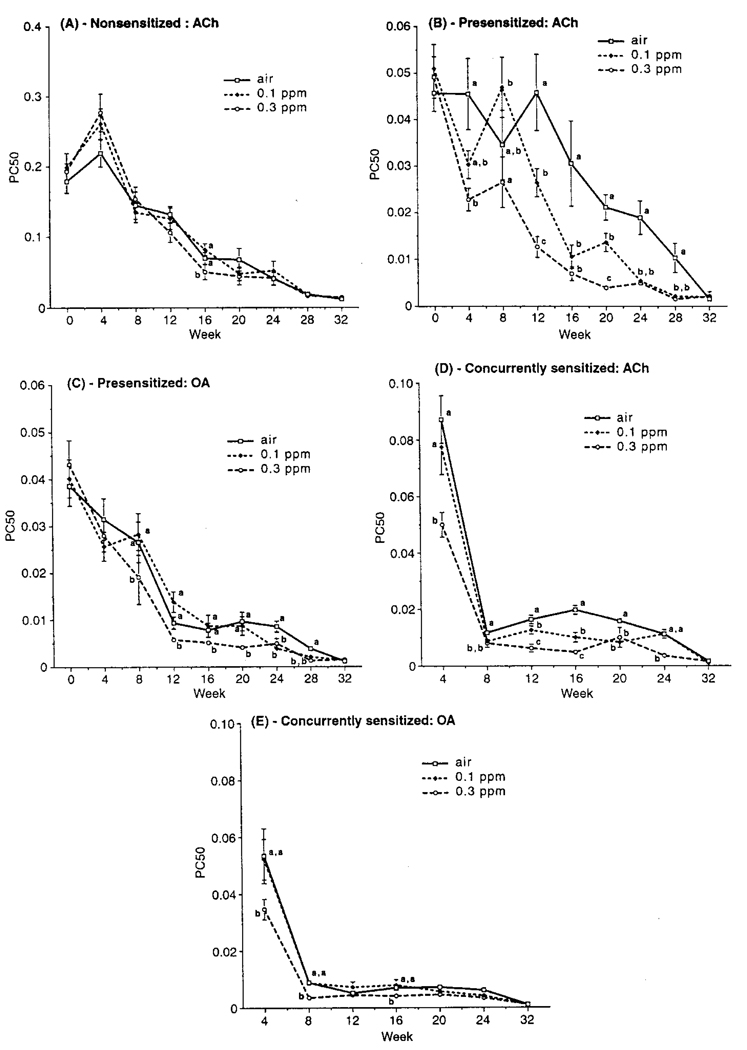
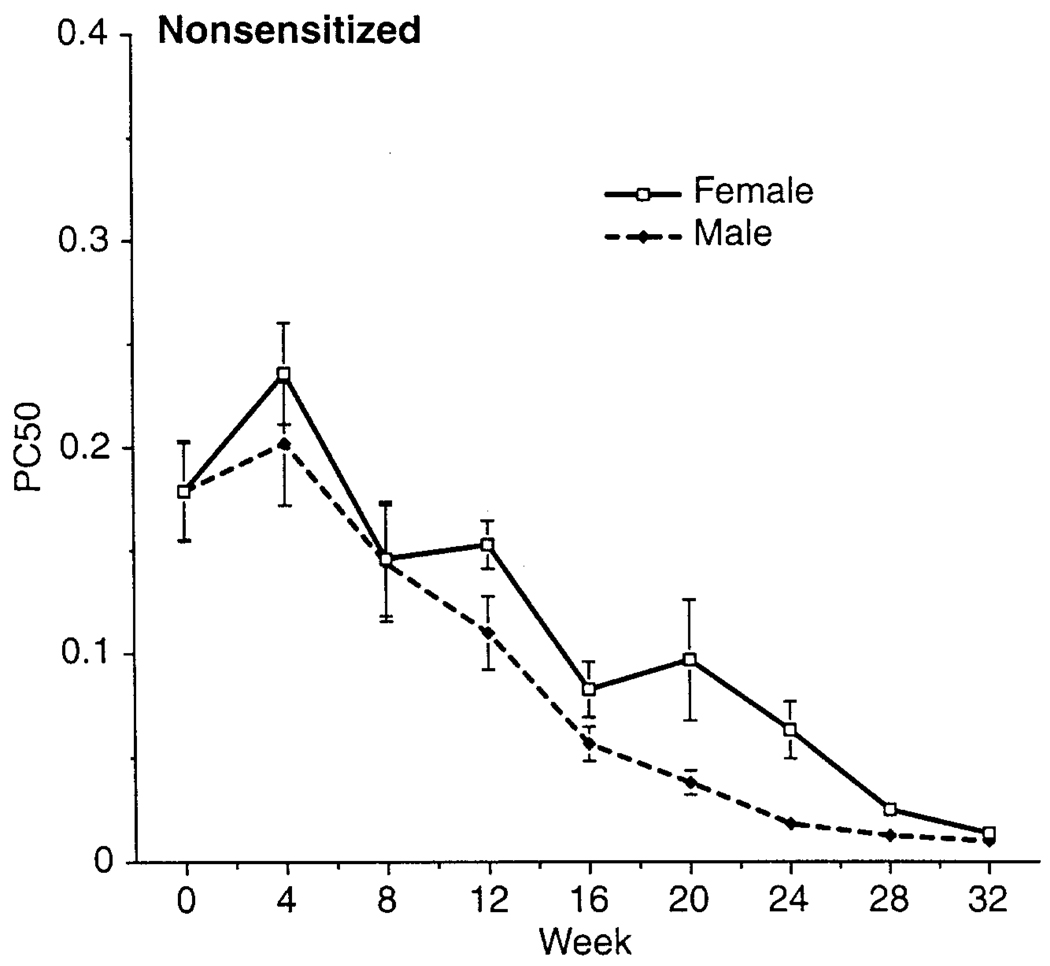
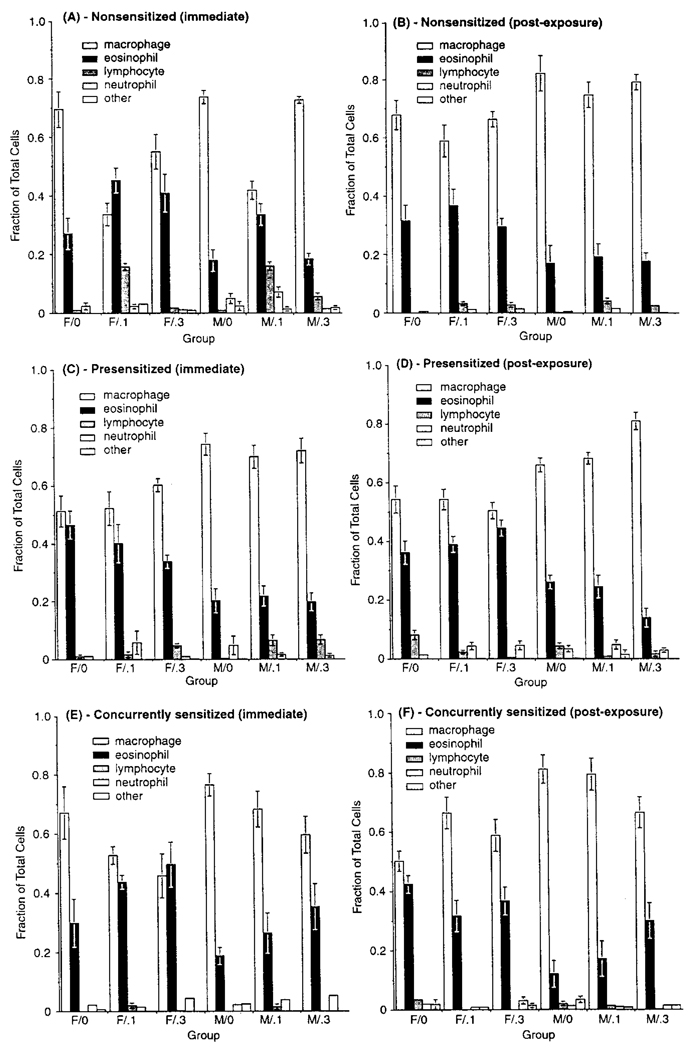
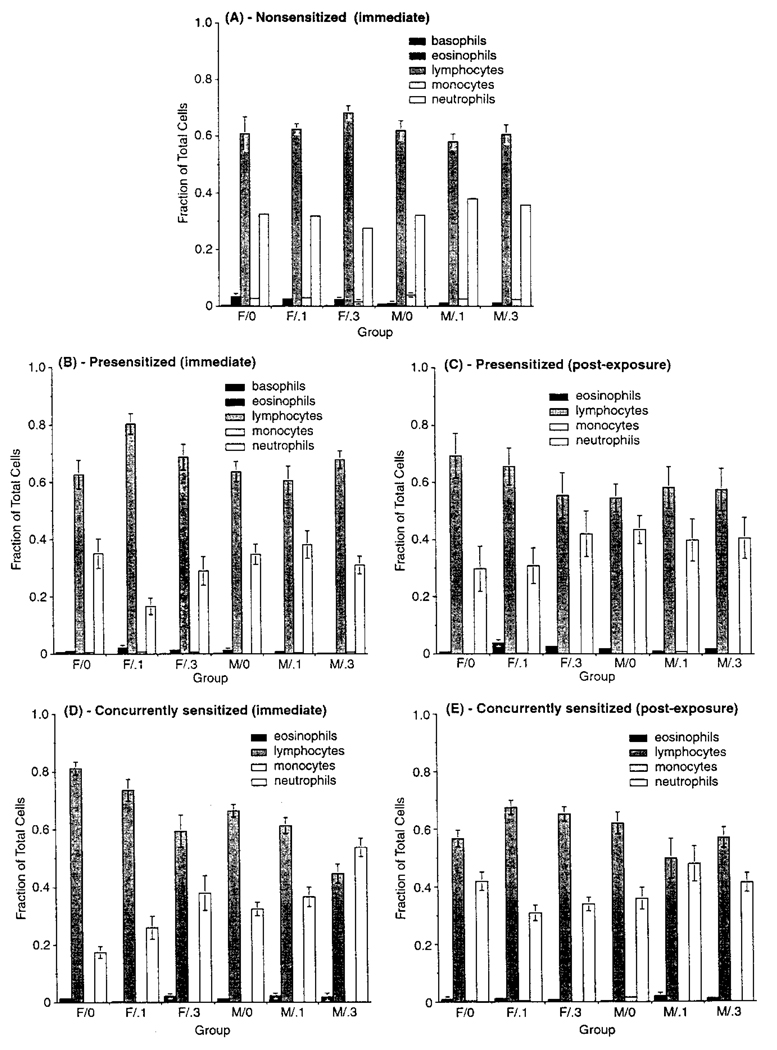
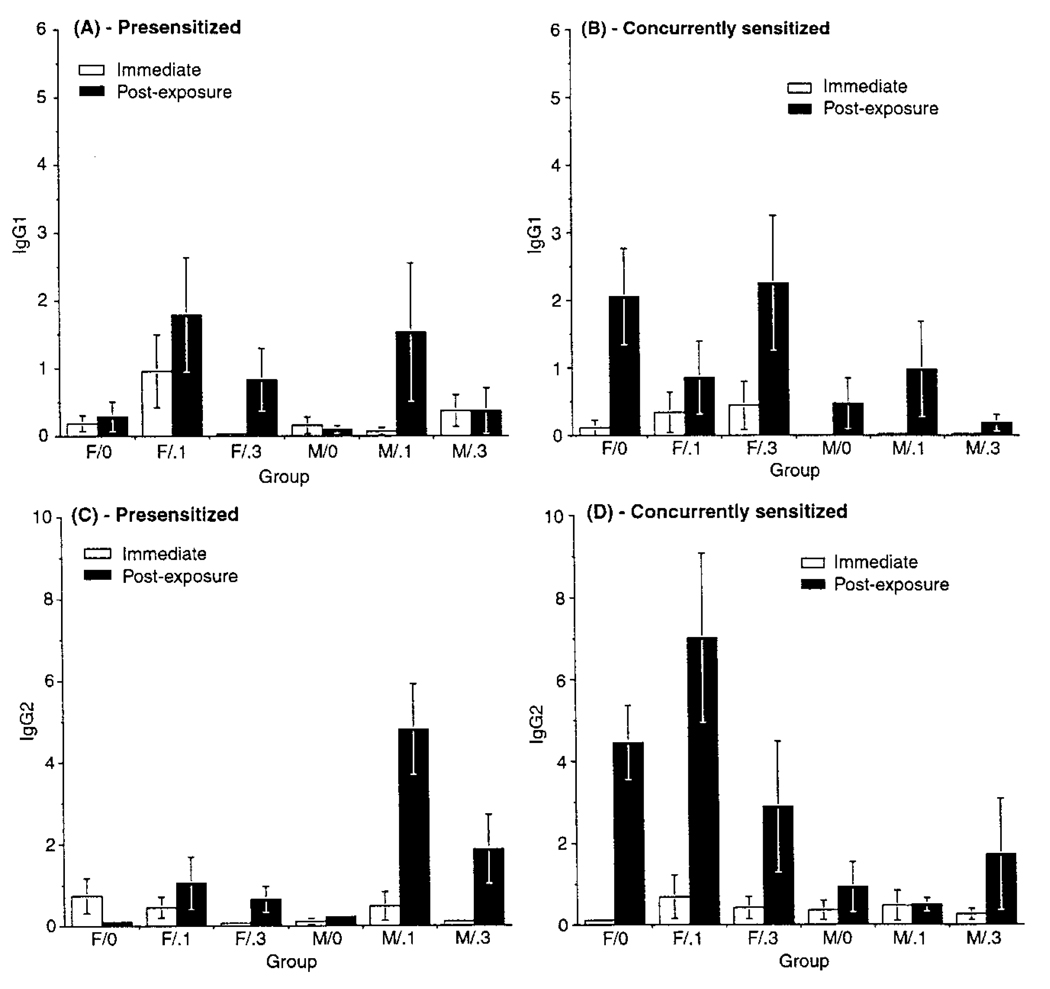
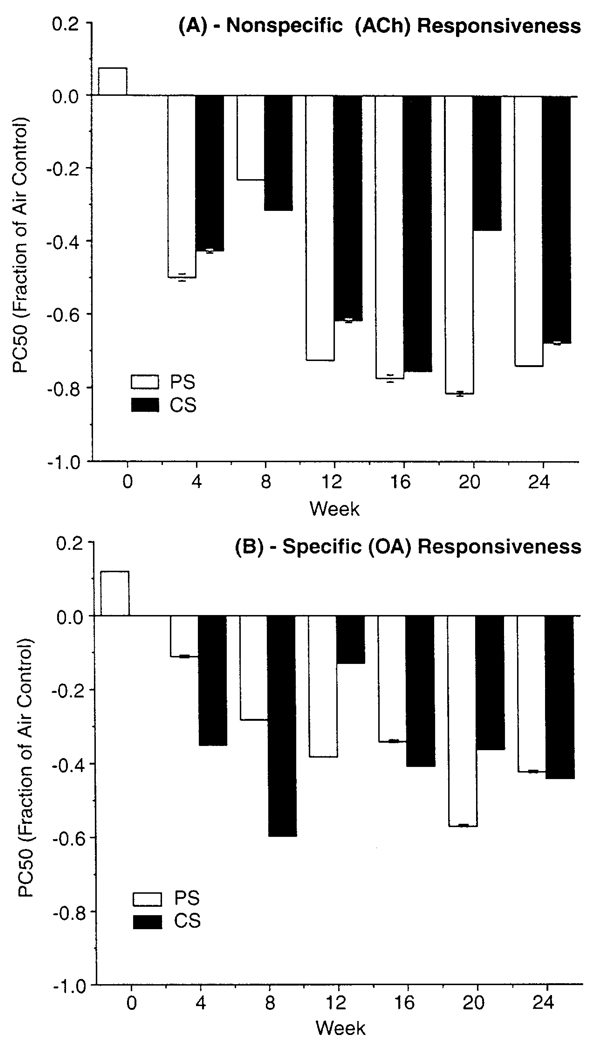
While acute exposures to ozone (O(3)) can alter airway responsiveness, effects from long-term exposures at low concentrations are less clear. This study assessed whether such exposures could induce nonspecific hyperresponsiveness in nonatopic (nonsensitized) guinea pigs and/or could exacerbate the pre-existing hyperresponsive state in atopic (sensitized) animals, and whether gender was a factor modulating any effect of O(3). Responsiveness was measured during and following exposures to 0.1 and 0.3 ppm O(3) for 4 h/day, 4 days/wk for 24 wk in male and female nonsensitized animals, those sensitized to allergen (ovalbumin) prior to initiation of O(3) exposures, and those sensitized concurrently with exposures. Ozone did not produce hyperresponsiveness in nonsensitized animals, but did exacerbate hyperresponsiveness to both specific and nonspecific bronchoprovocation challenges in sensitized animals, an effect that persisted through at least 4 wk after exposures ended. Gender was not a factor modulating response to O(3). Induced effects on responsiveness were not associated with numbers of eosinophils in the lungs nor with any chronic pulmonary inflammatory response, but were correlated with antigen-specific antibodies in blood. This study supports a role for chronic O(3) exposure in the exacerbation of airways dysfunction in a certain segment of the general population, namely, those demonstrating atopy.
Figures
Similar articles
-
Ozone-induced modulation of airway hyperresponsiveness in guinea pigs.Res Rep Health Eff Inst. 2002 Jun;(109):1-40; discussion 41-51. Res Rep Health Eff Inst. 2002. PMID: 12322853
-
Protective Role of Eosinophils and TNFa after Ozone Inhalation.Res Rep Health Eff Inst. 2017 Mar;2017(191):1-41. Res Rep Health Eff Inst. 2017. PMID: 29659241 Free PMC article.
-
Interaction of ozone exposure with airway hyperresponsiveness and inflammation induced by trimellitic anhydride in sensitized guinea pigs.J Toxicol Environ Health. 1997 May;51(1):77-87. doi: 10.1080/00984109708984012. J Toxicol Environ Health. 1997. PMID: 9169062
-
Effect of ozone exposure on antigen-induced airway hyperresponsiveness in guinea pigs.J Toxicol Environ Health. 1994 Aug;42(4):435-42. doi: 10.1080/15287399409531893. J Toxicol Environ Health. 1994. PMID: 8051717
-
[Toxicology of ozone and other photo-oxidants].Ann Ist Super Sanita. 1990;26(2):197-201. Ann Ist Super Sanita. 1990. PMID: 2260796 Review. Italian.
Cited by
-
A role for associated transition metals in the immunotoxicity of inhaled ambient particulate matter.Environ Health Perspect. 2002 Oct;110 Suppl 5(Suppl 5):871-5. doi: 10.1289/ehp.02110s5871. Environ Health Perspect. 2002. PMID: 12426150 Free PMC article.
-
Indoor pollutant exposure is associated with heightened respiratory symptoms in atopic compared to non-atopic individuals with COPD.BMC Pulm Med. 2014 Sep 10;14:147. doi: 10.1186/1471-2466-14-147. BMC Pulm Med. 2014. PMID: 25205263 Free PMC article.
References
-
- Abraham W, Januszkiewicz AJ, Mingle M, Welker M, Wanner A, Sackner A. Sensitivity of bronchoprovocation and tracheal mucous velocity in detecting airway response to O3. J. Appl. Physiol. 1980;48:789–793. - PubMed
-
- Adams WC, Savin W, Christo AE. Detection of ozone toxicity during continuous exercise via the effective dose concept. J. Appl. Physiol. 1981;51:415–422. - PubMed
-
- Agrawal KP. Specific airway conductance in guinea pigs: Normal values and histamine induced fall. Respir. Physiol. 1981;43:23–30. - PubMed
-
- Ahmed T, Eyre P, Januszkiewicz J, Wanner A. Role of H1- and H2-receptors in airway reactions to histamine in conscious sheep. J. Appl. Physiol. 1980;49:826–833. - PubMed
-
- Beasley R, Roche WM, Roberts JA, Holgate ST. Cellular events in the bronchi in mild asthma and after bronchial provocation. Am. Rev. Respir. Dis. 1989;139:806–817. - PubMed
Publication types
MeSH terms
Substances
Grants and funding
LinkOut - more resources
Full Text Sources
Medical