. 2002 May 28;99(11):7490-5.
doi: 10.1073/pnas.122039999.

Placental overgrowth in mice lacking the imprinted gene Ipl

Affiliations

Placental overgrowth in mice lacking the imprinted gene Ipl

Dale Frank et al. Proc Natl Acad Sci U S A. .

Abstract

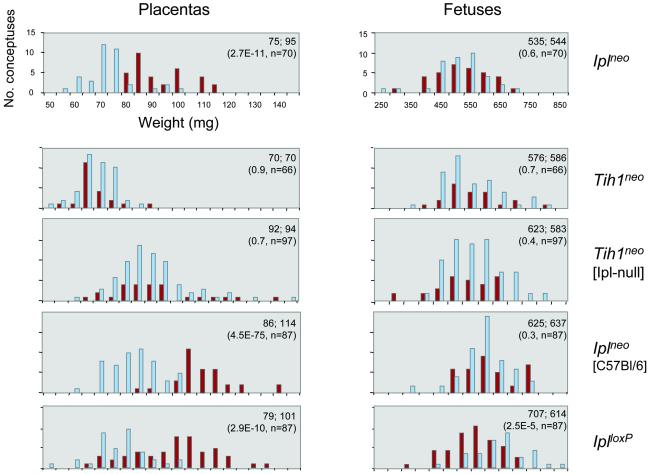
The Ipl (Tssc3) gene lies in an extended imprinted region of distal mouse chromosome 7, which also contains the Igf2 gene. Expression of Ipl is highest in placenta and yolk sac, where its mRNA is derived almost entirely from the maternal allele. Ipl encodes a small cytoplasmic protein with a pleckstrin-homology (PH) domain. We constructed two lines of mice with germ-line deletions of this gene (Ipl(neo) and Ipl(loxP)) and another line deleted for the similar but nonimprinted gene Tih1. All three lines were viable. There was consistent overgrowth of the Ipl-null placentas, with expansion of the spongiotrophoblast. These larger placentas did not confer a fetal growth advantage; fetal size was normal in Ipl nulls with the Ipl(neo) allele and was decreased slightly in nulls with the Ipl(loxP) allele. When bred into an Igf2 mutant background, the Ipl deletion partially rescued the placental but not fetal growth deficiency. Neither fetal nor placental growth was affected by deletion of Tih1. These results show a nonredundant function for Ipl in restraining placental growth. The data further indicate that Ipl can act, at least in part, independently of insulin-like growth factor-2 signaling. Thus, genomic imprinting regulates multiple pathways to control placental size.


Figures

Figure 1
Figure 1
Germ-line deletions of the Ipl and Tih1 genes. (A) Replacement of Ipl by Pgk-Neo or loxP. Regions included in the targeting vector are indicated in bold. Recombined loxP sites are the triangle. Exons are rectangles. K, KpnI; B, BamHI; US, upstream probe; DS, downstream probe. (B) Southern blot of mouse DNAs with genotypes indicated. (C) Northern blot showing loss of Ipl mRNA in yolk sacs with +/− maternal (mat) and −/− genotypes and wild-type levels of Ipl mRNA in yolk sac with +/− paternal (pat) genotype. Similar results were obtained with placental RNAs. The arrow indicates the major Ipl transcript. Assignment of mat and pat alleles in this heterozygous cross is inferred from analyses of other crosses in which one parent was Ipl−/− and the other was Ipl+/+. (D) Northern blot characterizing the Tih1 deletion with RNA from embryo fibroblasts. EtBr, ethidium bromide.
Figure 2
Figure 2
Isolated placental overgrowth in Ipl-null conceptuses. Data are shown for heterozygous crosses at 16.5 days postcoitum (dpc). Dark red bars denote conceptuses null for expression; light blue denotes positive for expression of the genes indicated on the right. Placental overgrowth is seen in the Ipl-null conceptuses with both the Iplneo and the IplloxP deletions and is accentuated after back-crossing to C57BL/6 for six generations (Iplneo [C57BL/6]). Fetal overgrowth is not observed. Deletion of Tih1 affects neither embryonic nor placental weight, but the placental weight distribution is shifted upward in the Ipl-null background (Tih1neo [Ipl-null]). Ipl-positive refers to combined +/+ and +mat/−pat genotypes, and Ipl-negative refers to combined −/− and −mat/+pat with assignment of paternal and maternal alleles inferred from expression in the yolk sacs. Tih1-positive refers to combined +/+ and +/− genotypes; Tih1-negative refers to the −/− genotype. Similar results were obtained when only Tih1+/+ and Tih1−/− genotypes were compared. Weights (mg) and t tests are shown as mean(expression-positive); mean(expression-negative); t value, number of conceptuses.
Figure 3
Figure 3
Ipl protein marks a subpopulation of trophoblast. (A) Antipeptide antibody detects Ipl protein confined to the labyrinth. This layer has expanded by 14.5 dpc, but the number of Ipl-expressing cells is relatively reduced. The intensity of staining per expressing cell remains constant. sp, spongiotrophoblast; la, labyrinthine trophoblast. (B) Higher magnification shows that the Ipl-positive cells are clustered between blood vessels (small bold arrows; type II cells) and do not include the large type I trophoblast cells that are adjacent to maternal blood vessels (large bold arrows). The small plain arrows indicate type III cells that extend the Ipl-positive cytoplasmic process around fetal vessels. BrdUrd (BrdU) is incorporated in type II cell nuclei but not in differentiated type I cells. mv, maternal blood vessel; fv, fetal blood vessel.
Figure 4
Figure 4
Expansion of spongiotrophoblast in Ipl-null placentas. (A) Midline placental sections (hematoxylin/eosin) from the IplloxP line at 16.5 dpc. There is a global increase in placental size with deletion of Ipl, but the spongiotrophoblast (sp) is expanded disproportionately. la, labyrinthine trophoblast. (B) Ratios of the area of spongiotrophoblast to labyrinth (Spong/Lab) in midline sections of placentas from heterozygous crosses (16.5 dpc). Data from single crosses are shown. In data from four heterozygous crosses with the IplloxP line, combined after normalization to the mean value for each cross, the ratio was 1.22 ± 0.20 and 0.78 ± 0.13 for the Ipl-null (Neg) and Ipl-positive (Pos) placentas, respectively (n = 34). (C) High-power fields of Ipl-positive and Ipl-negative placentas. The panels on the left are from the Iplneo line at 12.5 dpc (PAS). Lines indicate the giant cell layer (gc) adjacent to maternal decidua (ma). The panels on the right are at 16.5 dpc (hematoxylin/eosin) centered on the spongiotrophoblast. There is expansion of this layer with an increase of glycogen-containing cells (arrow).
Figure 5
Figure 5
Deletion of Ipl promotes placental but not fetal growth in an Igf2-null background. (A) Placental and fetal weights of conceptuses with the indicated Ipl and Igf2 expression status, measured at 16.5 dpc. Deletion of Ipl partially rescues the placental growth retardation but does not rescue fetal growth in the Igf2 nulls. The horizontal and vertical bars indicate means and standard deviations. t tests for equivalence of the weight distributions are indicated. (B) Ratios of the area of the spongiotrophoblast to labyrinth (Spong/Lab) in midline sections of all Ipl+Igf2+ and IplIgf2 placentas obtained from pooling two crosses (16.5 dpc) carried out between the Iplneo and Igf2lacZ lines. Although the IplIgf2 placentas are slightly smaller than the controls, they show an increased spongiotrophoblast/labyrinth ratio.

References

    1. Qian N, Frank D, O'Keefe D, Dao D, Zhao L, Yuan L, Wang Q, Keating M, Walsh C, Tycko B. Hum Mol Genet. 1997;6:2021–2029. - PubMed
    1. Lee M P, Feinberg A P. Cancer Res. 1998;58:1052–1056. - PubMed
    1. DeChiara T M, Robertson E J, Efstratiadis A. Cell. 1991;64:849–859. - PubMed
    1. Baker J, Liu J P, Robertson E J, Efstratiadis A. Cell. 1993;75:73–82. - PubMed
    1. Leighton P A, Ingram R S, Eggenschwiler J, Efstratiadis A, Tilghman S M. Nature (London) 1995;375:34–39. - PubMed

Publication types

Associated data