

doi: 10.1073/pnas.112191399.
Symptomatic and asymptomatic benign prostatic hyperplasia: molecular differentiation by using microarrays
Affiliations
- PMID: 12032329
- PMCID: PMC124296
- DOI: 10.1073/pnas.112191399
Item in Clipboard
Symptomatic and asymptomatic benign prostatic hyperplasia: molecular differentiation by using microarrays
Proc Natl Acad Sci U S A.
.
Abstract
Benign prostatic hyperplasia (BPH) is a disease of unknown etiology that significantly affects the quality of life in aging men. Histologic BPH may present itself either as symptomatic or asymptomatic in nature. To elucidate the molecular differences underlying BPH, gene expression profiles from the prostate transition zone tissue have been analyzed by using microarrays. A set of 511 differentially expressed genes distinguished symptomatic and asymptomatic BPH. This genetic signature separates BPH from normal tissue but does not seem to change with age. These data could provide novel approaches for alleviating symptoms and hyperplasia in BPH.
Figures
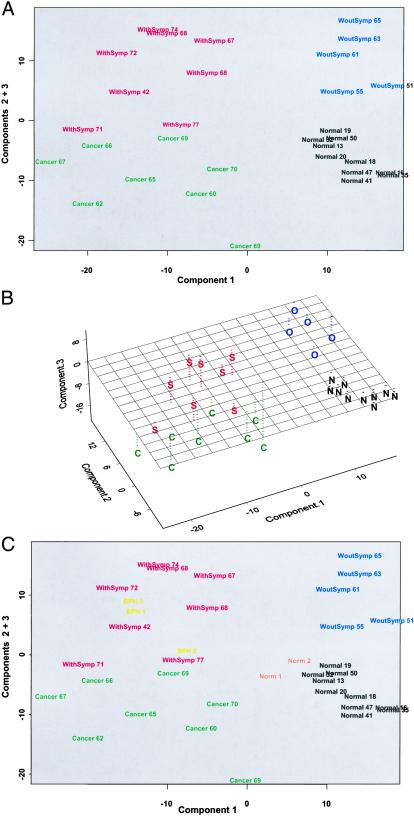
PCA. (A) A two-dimensional plot of the data showing the separation of the four sample groups. (B) A three-dimensional plot of the same data. (C) A two-dimensional plot of the data including the additional normal (Norm 1 & 2) and symptomatic BPH samples (BPH 1, 2, and 3). The four sample groups are normal (N), asymptomatic BPH (O), symptomatic BPH (S), and BPH with cancer (C) and include the age of the individual patient. S-PLUS was used to perform the ANOVA, PCA, and hierarchical clustering analyses. For the PCA, the correlation matrix on nontransformed expression values were used.
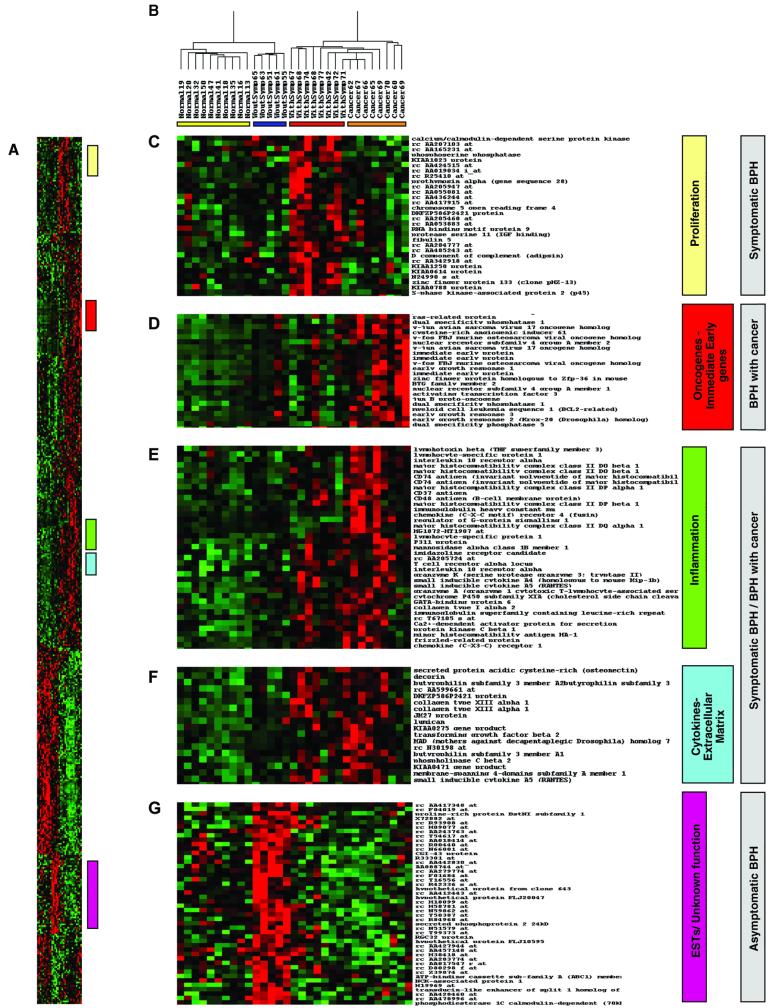
Two-dimensional hierarchical clustering. (A) Expression pattern of 511 genes obtained by PCA in 31 experimental samples. Rows represent individual genes, and columns represent individual samples. Each cell in the matrix represents the expression level of a single transcript in a single sample, with red and green indicating transcript levels above and below the median for that gene across all samples, respectively. Color saturation is proportional to the magnitude of the difference from the mean. Expression values are represented as Z-scores [(expression-gene mean) gene SD]. (B) Dendrogram showing overall similarity in expression profiles in the respective samples. Four clear subdivisions are present, each representing a distinct sample group. A colored bar under each group denotes this separation. (C–G) Colored bars alongside the matrix denote clusters of genes with similar cellular functions that are associated with the specific disease phenotypes (gray boxes).
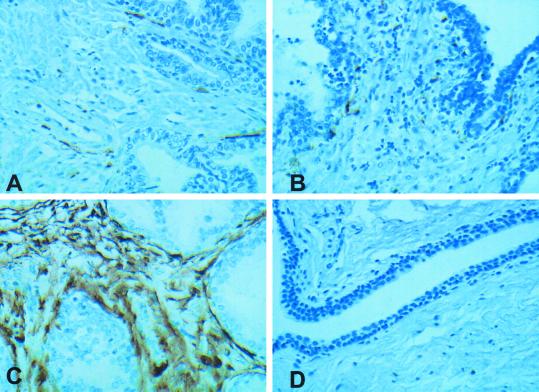
Immunohistochemical localization of JM27. Normal prostate (A), asymptomatic (B) and symptomatic BPH (C) tissue samples stained with anti-peptide JM27 antibody, respectively. (D) Symptomatic BPH tissue stained with preimmune serum as a control. All images were taken at ×400 magnification.
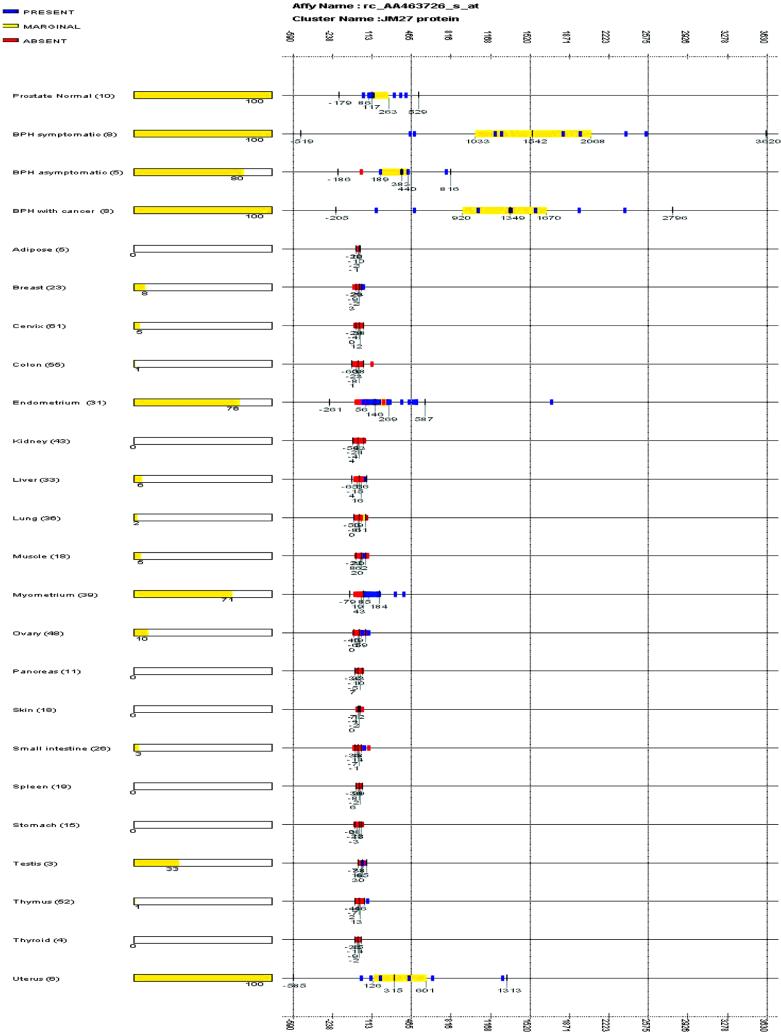
Tissue-specific expression of JM27. The expression values consisting of present (blue), marginal (yellow), and absent (red) calls for the JM27 gene fragment (AA463726) are plotted across prostate normal, symptomatic BPH, asymptomatic BPH, BPH with cancer, and 20 different normal human tissue sample sets. For each sample set, vertical bars are displayed at the median value and the upper 75 and 25 percentile range (bound by an orange box). The extreme vertical bars are located three SDs from the median. The x axis shows graduated markers indicating expression intensity. The number of samples in each set is noted within parentheses, and the percentage of samples where the gene is scored present is indicated as an orange bar at the right of the sample set name.
References
-
- Caprino L. Minerva Urol Nefrol. 2000;52:87–92. - PubMed
-
- Medina J J, Parra R O, Moore R G. Med Clin N Am. 1999;83:1213–1229. - PubMed
-
- Roper W G. Med Hypotheses. 1998;50:61–65. - PubMed
-
- Berthon P, Waller A S, Villette J M, Loridon L, Cussenot O, Maitland N J. Int J Cancer. 1997;73:910–916. - PubMed
-
- Bartsch G, Rittmaster R S, Klocker H. Eur Urol. 2000;37:376–380. - PubMed
MeSH terms
Substances
LinkOut - more resources
Full Text Sources
Other Literature Sources
Medical
