. 2002 May 28;99(11):7663-8.
doi: 10.1073/pnas.072210299.

Multiple archaeal groups mediate methane oxidation in anoxic cold seep sediments

Affiliations

Multiple archaeal groups mediate methane oxidation in anoxic cold seep sediments

Victoria J Orphan et al. Proc Natl Acad Sci U S A. .

Abstract

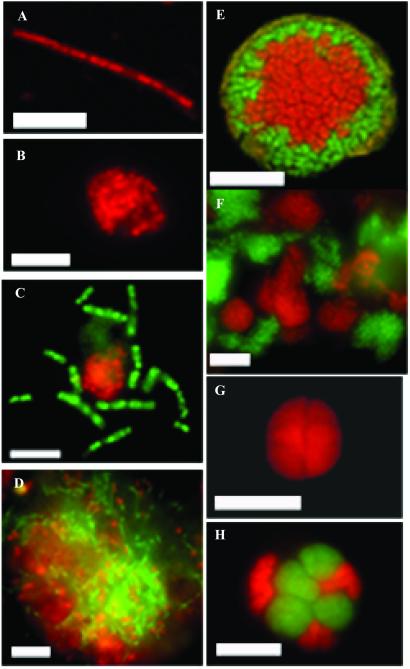
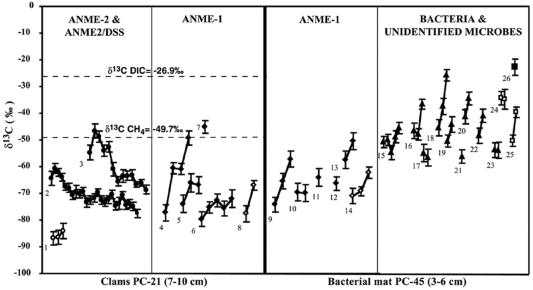
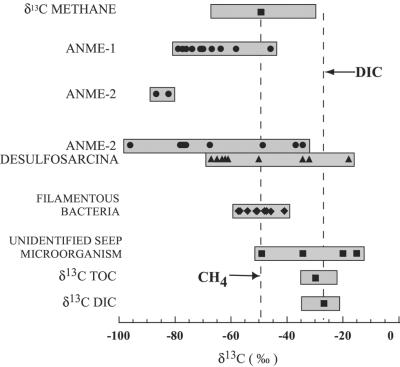
No microorganism capable of anaerobic growth on methane as the sole carbon source has yet been cultivated. Consequently, information about these microbes has been inferred from geochemical and microbiological observations of field samples. Stable isotope analysis of lipid biomarkers and rRNA gene surveys have implicated specific microbes in the anaerobic oxidation of methane (AOM). Here we use combined fluorescent in situ hybridization and secondary ion mass spectrometry analyses, to identify anaerobic methanotrophs in marine methane-seep sediments. The results provide direct evidence for the involvement of at least two distinct archaeal groups (ANME-1 and ANME-2) in AOM at methane seeps. Although both archaeal groups often occurred in direct physical association with bacteria, they also were observed as monospecific aggregations and as single cells. The ANME-1 archaeal group more frequently existed in monospecific aggregations or as single filaments, apparently without a bacterial partner. Bacteria associated with both archaeal groups included, but were not limited to, close relatives of Desulfosarcina species. Isotopic analyses suggest that monospecific archaeal cells and cell aggregates were active in anaerobic methanotrophy, as were multispecies consortia. In total, the data indicate that the microbial species and biotic interactions mediating anaerobic methanotrophy are diverse and complex. The data also clearly show that highly structured ANME-2/Desulfosarcina consortia are not the sole entities responsible for AOM at marine methane seeps. Other microbial groups, including ANME-1 archaea, are capable of anaerobic methane consumption either as single cells, in monospecific aggregates, or in multispecies consortia.


Figures

Figure 1
Figure 1
Individual cells and cell aggregates of ANME-1 and ANME-2 archaea from ERB sediments, visualized with fluorescent-labeled oligonucleotide probes. Unless otherwise indicated, scale bar represents 5 μm. (A) An ANME-1 archaeal filament stained with Cy-3 labeled ANME1–862 probe, portraying the characteristic features of the ERB ANME-1 group including a segmented ultrastructure and square shaped cell termini. (B) Tightly associated cluster of ANME-1 rods, stained with the same ANME-1 oligonucleotide probe. (C) Color overlay of archaeal ANME-1 rods visualized with the ANME1–862 probe labeled with fluorescein (in green), and Desulfosarcina spp. stained with the DSS_658 probe labeled with Cy-3 (in red). (D) Large archaeal ANME-1/sulfate-reducing Desulfosarcina aggregate, showing an apparently random association of the two groups. Scale bar = 10 μm. (E) Color overlay of a layered ANME-2/DSS aggregate showing a core of ANME-2 Archaea (hybridized with EelMSMX932 probe), surrounded by sulfate-reducing Desulfosarcina (hybridized with DSS658 probe) imaged by laser scanning confocal microscopy. (F) Large aggregation of loosely associated, individual microcolonies of ANME-2 (EelMSMX932_cy3), and Desulfosarcina (DSS658_FITC). (G) Monospecies aggregate of archaeal ANME-2 (EelMSMX932_cy3) not affiliated with a bacterial partner. (H) Color overlay documenting an association of the ANME-2 archaea with a bacterial partner not affiliated with the sulfate-reducing Desulfosarcina. The aggregate was simultaneously hybridized with three oligonucleotide probes, including two FITC labeled probes for the ANME-2 (EelMSMX932) and Desulfosarcina (DSS658), in combination with a Cy-3 labeled probe for bacteria (EUB338). In this aggregate, microcolonies of the ANME-2 were stained with FITC, but the bacterial Desulfosarcina were not detected. Instead, clusters of an unidentified Bacteria (in red), hybridizing with the general bacterial probe labeled with Cy-3, were associated with the archaeal ANME-2 cells (stained in green).
Figure 2
Figure 2
Ion microprobe measurements of δ13C profiles for individual cells and cell aggregates recovered from methane-seep samples underlying clams or bacterial mats (PC-21 and PC-45). The x axis represents the time course Cs+ ion beam exposure for each individual cell profile. Individual cell profiles are indicated by a line connecting the δ13C values measured over time during Cs+ ion-beam exposure. Dashed lines show δ13C values for DIC and methane in sample PC-21 as indicated. (○) Mono-species ANME-2 aggregate (no. 1). (●) ANME-2/DSS aggregates (nos. 2 and 3). (⧫) Individual ANME-1 rods (nos. 4–7 and 9–13). (⋄) ANME-1 rod aggregates (nos. 8 and 14). (σ) Bacterial filaments hybridized with general bacterial oligonucleotide probe Eub338 (nos. 15–23). (□) Unidentified microbial aggregate stained with DAPI (nos. 24 and 25). (■) Diatom frustule (no. 26). The analytical precisions shown (1σ) are appropriate within each depth profile, but do not account for the uncertainty in the calibration of the y axis (±5‰ in this case).
Figure 3
Figure 3
Bar graph comparing the range of δ13C values measured for individual methanotrophic archaea, sulfate reducing bacteria, or other seep-associated microorganisms as measured by SIMS. Individual points represent either the initial SIMS values recorded for single cells or cell aggregates (ANME-1, ANME-2 alone, bacterial rods, and Desulfosarcina shells), or the eventual value obtained during depth profiling (ANME-2 cores). The plotted SIMS values are pooled from this study with those of a published report (13). Values of δ13C for methane, dissolved inorganic carbon (DIC), and total organic carbon (TOC) all originate from samples collected at the ERB during the 1999 ERB cruise (C. Paull and B. Ussler, personal communication). Bars represent the range of values measured for the different cell types, methane, DIC and TOC from ERB methane seeps. The methane data point corresponds to the pore-water methane concentrations measured in sample PC-21, with the range of ERB methane δ13C values representing all those measured during the 1999 ERB cruise.

References

    1. Valentine D L, Reeburgh W S. Environ Microbiol. 2000;2:477–484. - PubMed
    1. Hinrichs K-U, Boetius A. In: Ocean Margin Systems. Wefer G, Billett D, Hebbeln D, Jørgensen B B, Schlüter M, van Weering T, editors. Heidelberg: Springer; 2002. , in press.
    1. Hinrichs K-U, Hayes J M, Sylva S P, Brewer P G, DeLong E F. Nature (London) 1999;398:802–805. - PubMed
    1. Orphan V J, Hinrichs K-U, Ussler W, Paull C K, Taylor L T, Sylva S A, Hayes J M, DeLong E F. Appl Environ Microbiol. 2001;67:1922–1934. - PMC - PubMed
    1. Hinrichs K-U, Summons R E, Orphan V J, Sylva S P, Hayes J M. Org Geochem. 2000;31:1685–1701.

Publication types

MeSH terms

LinkOut - more resources