. 2002 Jun;119(6):593-612.
doi: 10.1085/jgp.20018495.

HEK293S cells have functional retinoid processing machinery

Affiliations

HEK293S cells have functional retinoid processing machinery

Lioubov I Brueggemann et al. J Gen Physiol. 2002 Jun.

Abstract

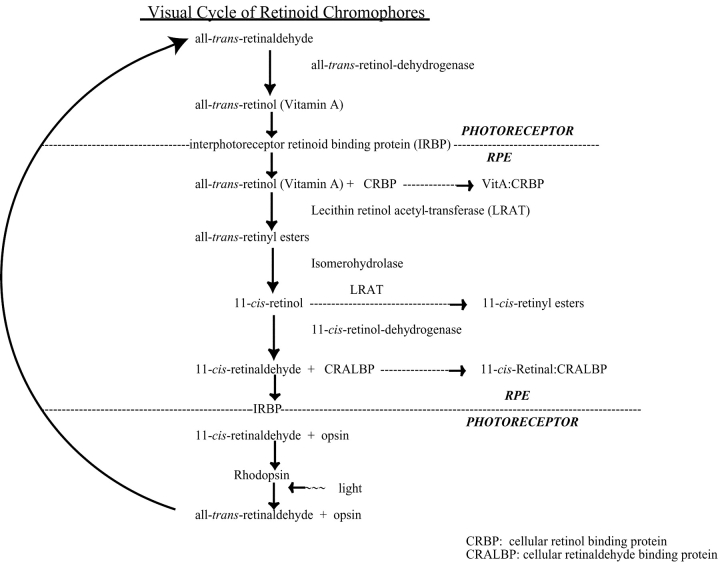
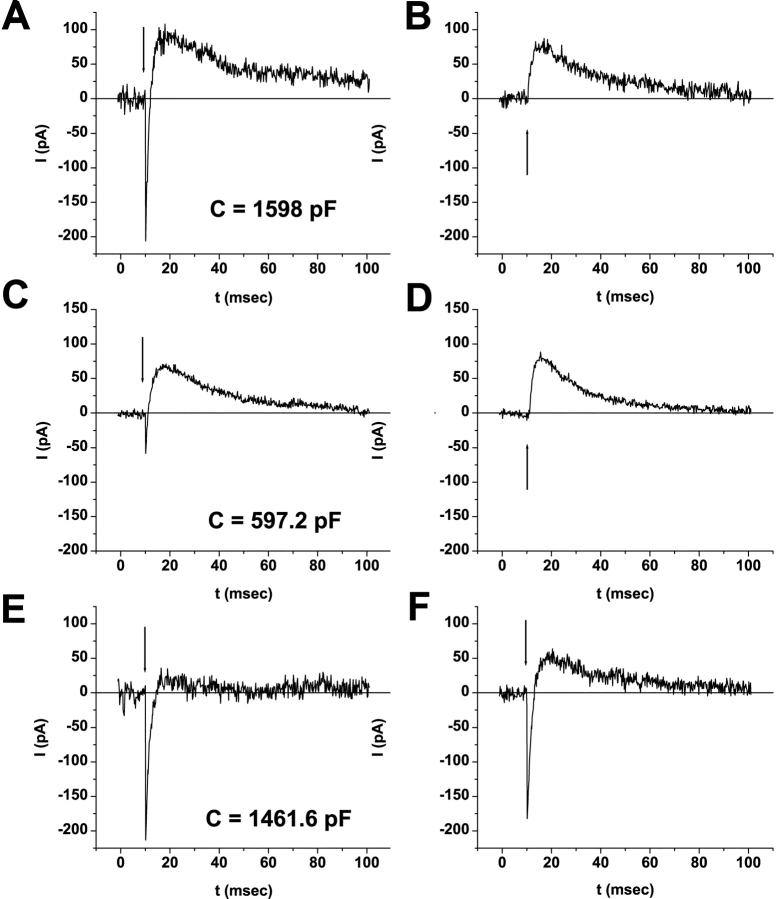
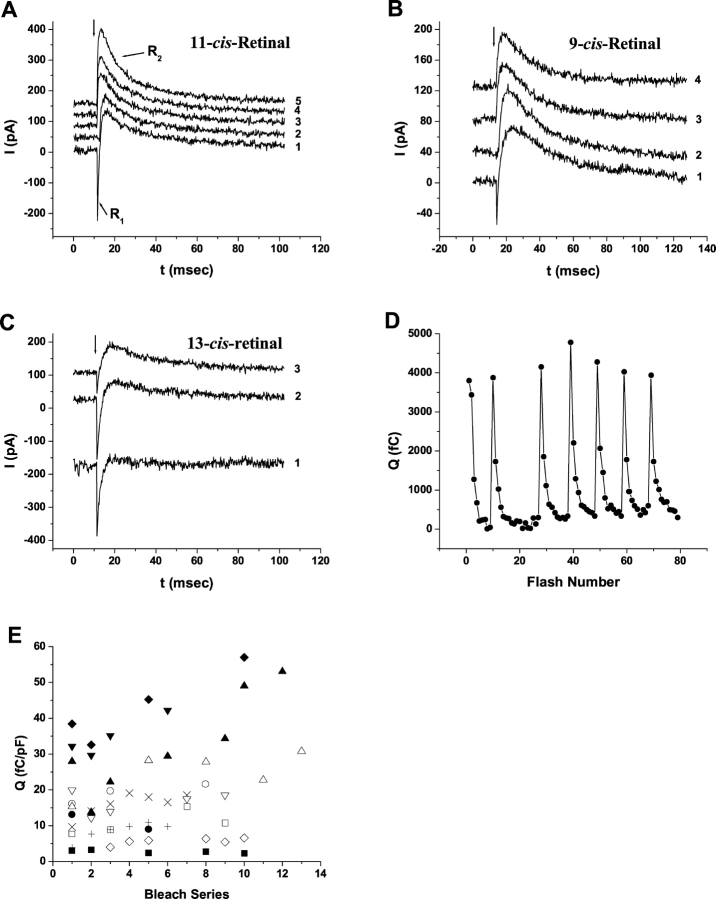
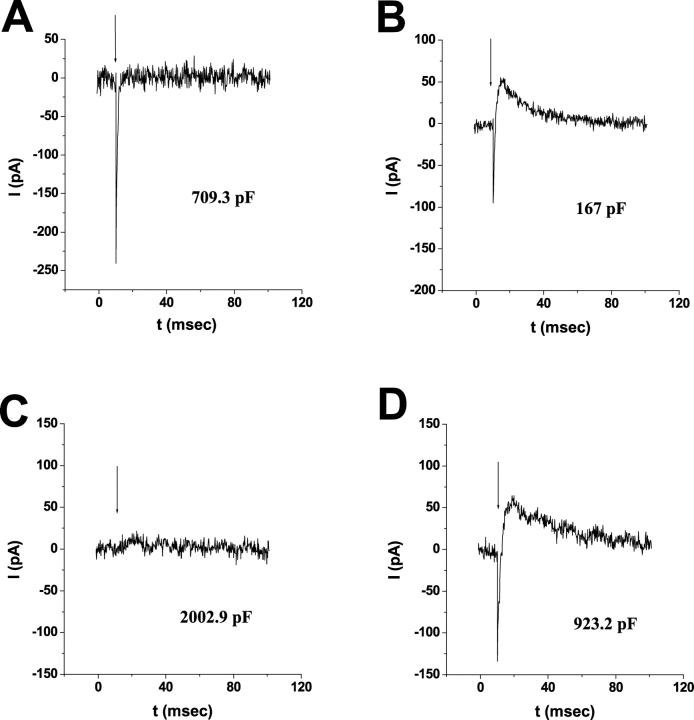
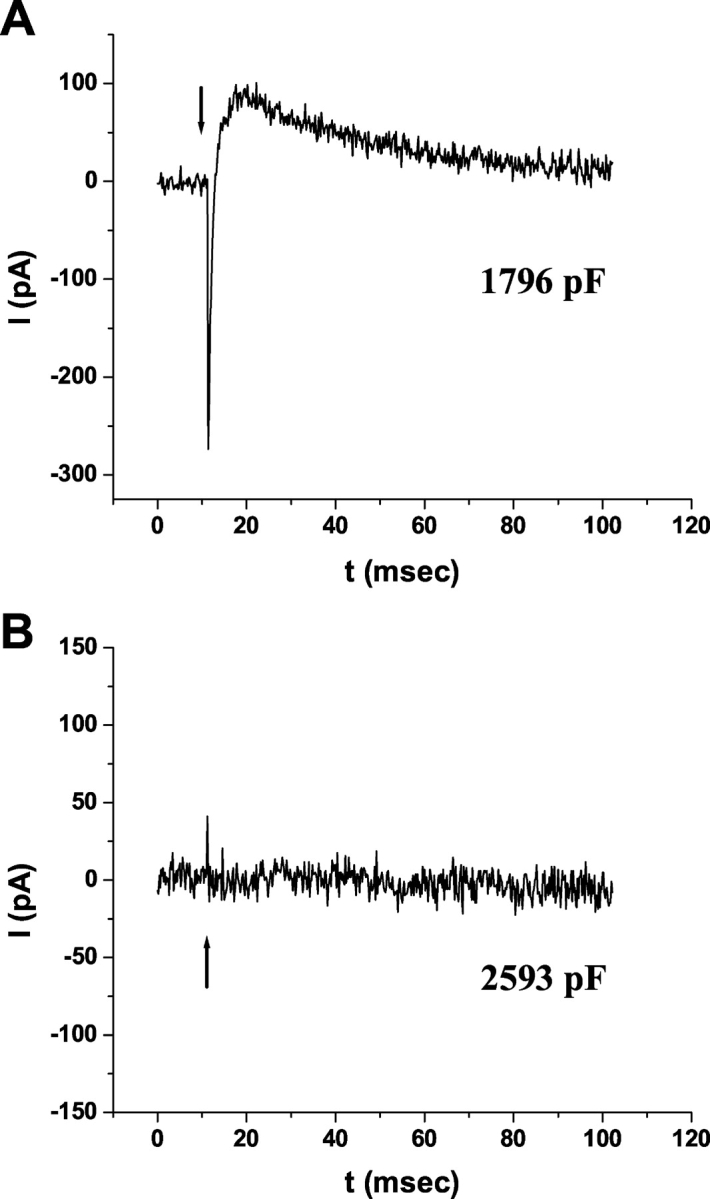
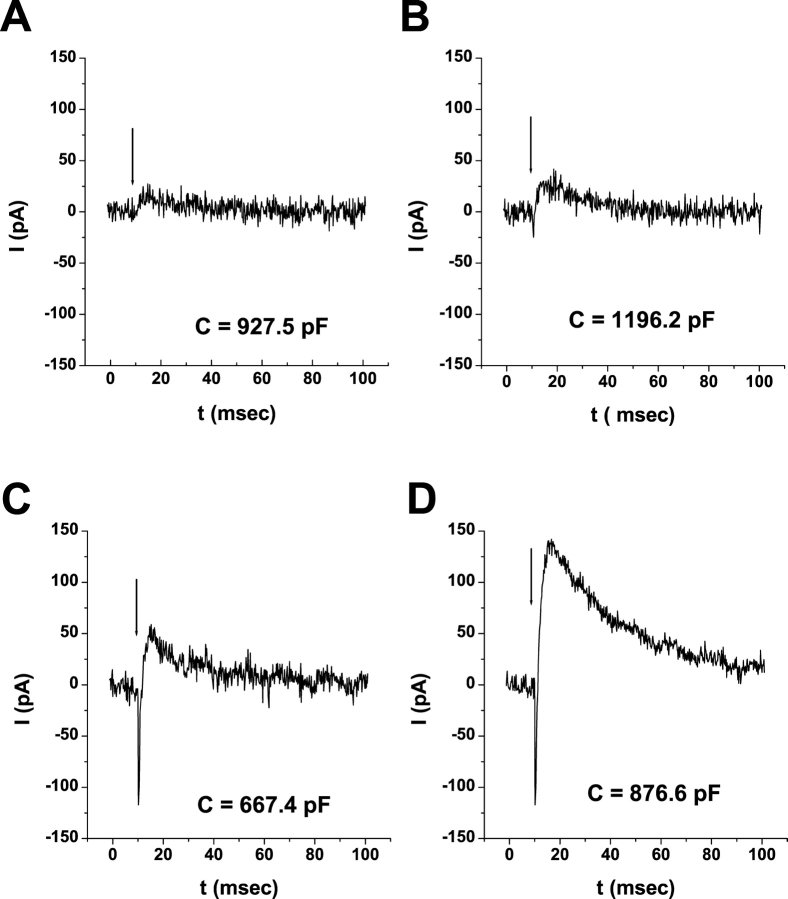
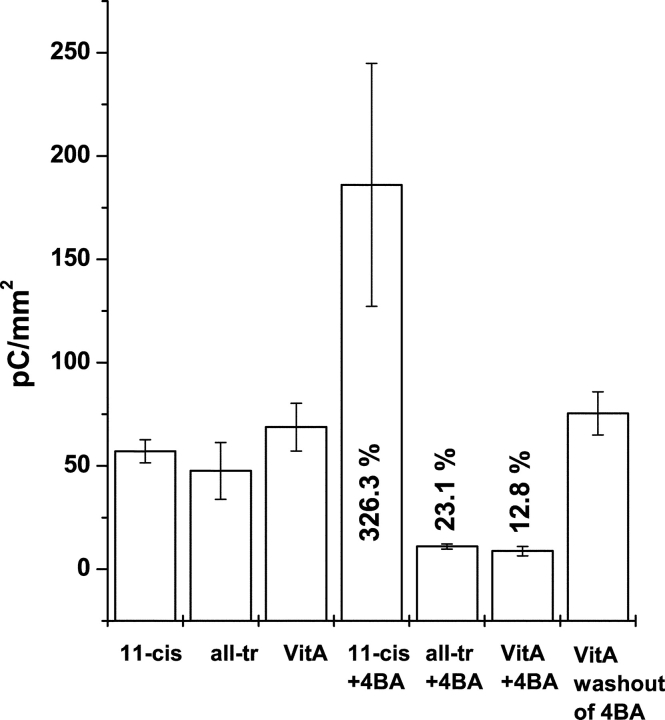
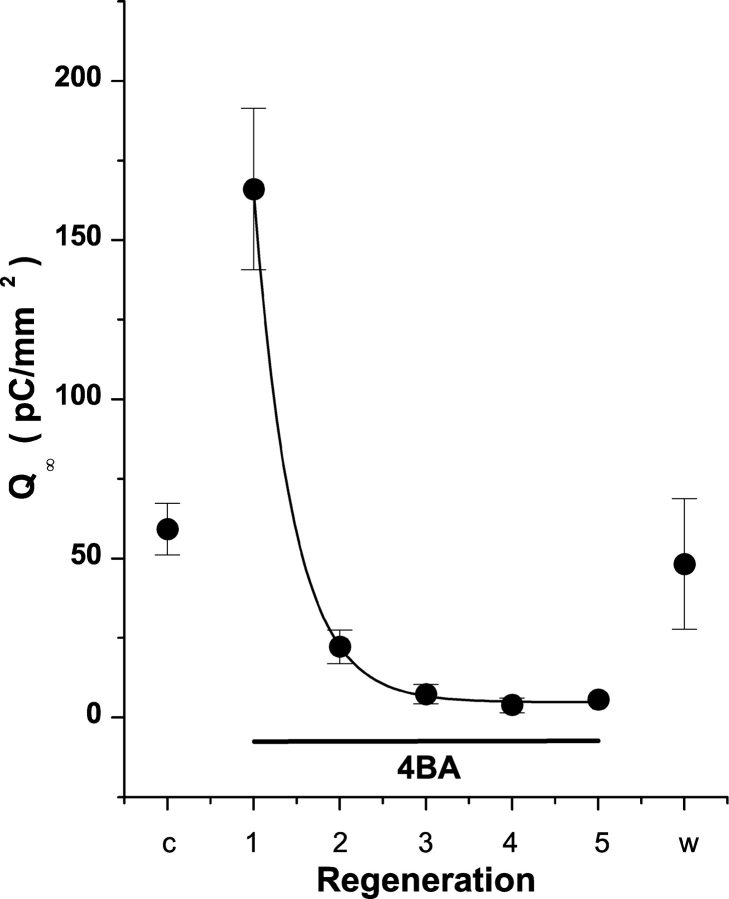
Rhodopsin activation is measured by the early receptor current (ERC), a conformation-associated charge motion, in human embryonic kidney cells (HEK293S) expressing opsins. After rhodopsin bleaching in cells loaded with 11-cis-retinal, ERC signals recover in minutes and recurrently over a period of hours by simple dark adaptation, with no added chromophore. The purpose of this study is to investigate the source of ERC signal recovery in these cells. Giant HEK293S cells expressing normal wild-type (WT)-human rod opsin (HEK293S) were regenerated by solubilized 11-cis-retinal, all-trans-retinal, or Vitamin A in darkness. ERCs were elicited by flash photolysis and measured by whole-cell recording. Visible flashes initially elicit bimodal (R(1), R(2)) ERC signals in WT-HEK293S cells loaded with 11-cis-retinal for 40 min or overnight. In contrast, cells regenerated for 40 min with all-trans-retinal or Vitamin A had negative ERCs (R(1)-like) or none at all. After these were placed in the dark overnight, ERCs with outward R(2) signals were recorded the following day. This indicates conversion of loaded Vitamin A or all-trans-retinal into cis-retinaldehyde that regenerated ground-state pigment. 4-butylaniline, an inhibitor of the mammalian retinoid cycle, reversibly suppressed recovery of the outward R(2) component from Vitamin A and 11-cis-retinal-loaded cells. These physiological findings are evidence for the presence of intrinsic retinoid processing machinery in WT-HEK293S cells similar to what occurs in the mammalian eye.


Figures

F<sc>igure</sc> 1.
Figure 1.
The visual cycle of retinoid chromophores in the vertebrate eye. The chromophores, enzymes, binding proteins, and cell types are indicated for the major components of the cycle. Vitamin A in the serum or from photoreceptors with bleached pigment is transferred across the RPE plasma membrane and binds to CRBP-I, whereupon it is esterified to membrane lipids by LRAT (Barry et al., 1989). Exergonic hydrolysis of the all-trans-retinyl ester is coupled to endogonic isomerization that forms 11-cis-retinol, which is either esterified by LRAT or oxidized by 11-cis-retinol dehydrogenase (11cRDH) to yield 11-cis-retinal (Rando, 1991, 1992). The isomerase and the hydrolase are hypothesized to form a membrane-associated multiprotein/enzymatic complex called the IH (Bernstein et al., 1987; Barry et al., 1989; Rando, 1992) that engages LRAT (Rando, 1991) and possibly other regulatory units (e.g., RPE65). 11-cis-retinal in the RPE cytoplasm is solubilized by binding to CRALBP, which stores and traffics the ligand to partition into the RPE plasma membrane (Crabb et al., 1998). 11-cis-retinal complexes with abundant interstitial retinoid binding protein (IRBP) and albumin in the extracellular space between the apical RPE microvilli and outer segment plasma membranes of photoreceptors (Adler and Edwards, 2000). In photoreceptors, 11-cis-retinal forms a covalent protonated Schiff base linkage with a conserved lysine in the seventh transmembrane domain of the rod or cone opsin apoprotein to regenerate the respective rhodopsin visual pigments. Hydrolyzed from bleached pigment, all-trans-retinal is converted back to Vitamin A in photoreceptors by all-trans-retinol dehydrogenase (tRDH) (Haeseleer et al., 1998; Saari et al., 1998) before being released into the extracellular space for reuptake by the RPE and conversion back into 11-cis-retinal.
F<sc>igure</sc> 2.
Figure 2.
ERC signals from WT-HEK293S cells regenerated with different cis-retinaldehydes. Fused WT-HEK293S giant cells were loaded with 25 μM 11-cis-retinal or 9-cis-retinal or 50 μM 13-cis-retinal complexed to FAF-BSA. ERC signals on the first 500-nm flash during the primary bleaching extinction (A, C, and E) and secondary bleaching extinctions (B, D, and F) are shown for 11-cis-retinal– (A and B), 9-cis-retinal– (C and D), and 13-cis-retinal– (E and F) loaded representative cells. Membrane capacitances of the cells are indicated. The arrow indicates the timing of the flash stimulus. Responses from each single cell are representative of larger populations of cells regenerated with 11-cis-retinal (n = 54), 9-cis-retinal (n = 5), and 13-cis-retinal (n = 4).
F<sc>igure</sc> 3.
Figure 3.
ERC signal recovery during serial bleaches and dark adaptation. Fused WT-HEK293S giant cells were loaded with 25 μM 11-cis-retinal overnight at 4°C (A), 25 μM 9-cis-retinal for 40 min at room temperature (B), or 50 μM 13-cis-retinal for 40 min at room temperature (C). Single ERC traces recorded upon the first flash in each bleach series are shown. The number adjacent to the trace indicates the bleach series. Membrane capacitance was 340 pF (A), 597.2 pF (B), and 1461.6 pF (C). A criterion of 10 min of dark adaptation occurred between each bleach series. A labels the R1 and R2 signals. D shows an example of repetitive bleach/recoveries on a WT-HEK293S giant cell (635.2 pF) loaded with 25 μM 11-cis-retinal for 40 min at room temperature. The R2 charges per flash (Qi) are shown versus flash number. Seven sequential bleaches are displayed. The vertical line drawn between charge extinction (near 0 fC) and the next maximum indicates the criterion period of 10 min of dark adaptation before the next flash series. E shows the R2 Q levels across serial bleaches under identical conditions for a set of cells (n = 12) loaded with 11-cis-retinal for 40 min at room temperature or overnight at 4°C. Gaps in the series for a single cell (each with unique symbol) indicate bleaches occurring under nonsymmetrical conditions of pH or with transmembrane voltage at nonzero values and are not included. Cells ranged in size from 93.5 to 577 pF.
F<sc>igure</sc> 4.
Figure 4.
ERC evidence for retinoid conversions in giant WT-HEK293S cells. Cells were loaded with 50 μM chromophore complexed to FAF-BSA in all cases. ERCs were obtained upon the first 500-nm flash from cells regenerated for 40 min at room temperature in darkness (A and C) or overnight at 4°C in darkness (B and D). Each panel is from a single cell. Cells were regenerated with all-trans-retinal (A and B) or Vitamin A (C and D). Cells are representative of larger populations of cells examined (all-trans-retinal, 40 min: n = 43, overnight at 4°C: n = 7; Vitamin A, 40 min: n = 2 cells, overnight at 4°C: n = 23 cells).
F<sc>igure</sc> 5.
Figure 5.
Vitamin A palmitate is not metabolized to cis-retinaldehydes in giant WT-HEK293S cells. Giant cells were regenerated with 50 μM Vitamin A (A) or 50 μM Vitamin A palmitate (B) overnight at 4°C in darkness and ERCs recorded upon the first 500-nm flash the following day. Membrane capacitances of the representative cells are indicated. Responses shown are representative of a larger population of Vitamin A palmitate–regenerated cells (n = 5).
F<sc>igure</sc> 6.
Figure 6.
4BA inhibits retinoid processing in giant WT-HEK293S cells. ERCs were obtained upon the first 500-nm flash from giant WT-HEK293S cells after overnight loading/regeneration in 50 μM all-trans-retinal with 0.5 mM 4BA (A) or 50 μM Vitamin A with 0.5 mM 4BA (B) and 1 h after overnight exposure of Vitamin A with 4BA followed by washout of chromophore and 4BA (C), or exposure of Vitamin A plus 4BA overnight-regenerated cells to 11-cis-retinal (50 μM) for 30 min (D). Responses are representative of larger cell populations studied (all-trans-retinal with 4BA, n = 12 cells; Vitamin A with 4BA, n = 31 cells).
F<sc>igure</sc> 7.
Figure 7.
Effect of 4BA on the quantity of ERC R2 charge motion. Giant WT-HEK293S cells were regenerated with 50 μM 11-cis-retinal (11cis, n = 9 cells), all-trans-retinal (allTr, n = 4), or Vitamin A (VitA, n = 13) as controls and with 0.5 mM 4BA inhibitor (+4BA: 11cis, n = 4; allTr, n = 4; VitA, n = 7 cells), and for Vitamin A after washout of the 4BA (VitA washout, n = 15 cells). The total extinguishable ERC R2 charge (Q) obtained from each cell was normalized to the cell area (mm2) to compensate for the effects of cell size on opsin levels (Sullivan and Shukla, 1999). Means ± standard error of mean are plotted. The additional numbers inside certain bars are the percent difference of the means of each retinoid with 4BA versus the mean in each retinoid alone. All statistical tests were conducted at the P < 0.05 level of confidence. Mean levels of R2 charge were significantly different across the entire set of experimental conditions (one-way analysis of variance [ANOVA], P = 1.8e−6). Mean levels of R2 charge were not statistically different between 11cis, allTr, VitA controls (ANOVA, P = 0.484). Mean levels of R2 charge were not statistically different for VitA and VitA after washout of 4BA (t test, P = 0.669). Levels of R2 charge were statistically different between 11cis versus 11cis+4BA (t test, P = 0.006), for allTr versus allTr+4BA (t test, P = 0.038), and VitA versus VitA+4BA (t test, P = 0.0015).
F<sc>igure</sc> 8.
Figure 8.
4BA inhibits dark adaptation in 11-cis-retinal–regenerated WT-HEK293S cells. Giant cells were regenerated with 50 μM 11-cis-retinal and cell surface area–normalized R2 charge motion obtained for the first bleach cycle (Control, c). 4BA complexed to FAF-BSA was then perfused through the chamber and the amount of R2 charge motion obtained in successive bleach cycles determined (1Æ5). Recovery time between bleach cycles was 10 min in all cases and flash stimulation was 500 nm. After the fifth bleach cycle, 4BA was washed out of the chamber and the recovery of R2 charge determined (washout, w). Control and washout conditions were not statistically different. The decay of R2 charge motion in 4BA (0.5 mM) was reliably fit with a single exponential model with a decay constant of 0.45 ± 0.01 cycles (P < 0.05). Data are presented as mean ± SE (n = 7 cells).
F<sc>igure</sc> 9.
Figure 9.
Lack of bulk BSA uptake into single or giant WT-HEK293S cells. Single (A and B) or giant PEG-fused (C and D) WT-HEK293S cells were exposed to regeneration buffer containing 1.9% (wt/vol) FAF-BSA plus 0.1% FITC-BSA. Hoffman contrast images of representative fields of single (A) or PEG-fused (C) WT-HEK293S cells are shown beside fluorescence images from the same respective fields (B and D). Arrows in A and B indicate healthy single cells and arrowheads indicate unhealthy single cells and single cells or debris taking up FITC-BSA. Scale marker is 20 μm in all fields and approximates the size of a single unfused HEK293S cell.

References

    1. Adler, A.J., and R.B. Edwards. 2000. Human interphotoreceptor matrix contains serum albumin and retinol-binding protein. Exp. Eye Res. 70:227–234. - PubMed
    1. Aho, A.-C., K. Donner, C. Hydén, L.O. Larsen, and T. Reuter. 1988. Low retinal noise in animals with low body temperature allows high visual sensitivity. Nature. 334:348–350. - PubMed
    1. Barry, R.J., F.J. Cañada, and R.R. Rando. 1989. Solubilization and partial purification of retinyl ester synthetase and retinoid isomerase from bovine ocular pigment epithelium. J. Biol. Chem. 264:9231–9238. - PubMed
    1. Baylor, D.A., G. Matthews, and K.-W. Yau. 1980. Two components of electrical dark noise in toad retinal rod outer segments. J. Physiol. 309:591–621. - PMC - PubMed
    1. Bernstein, P.S., B.S. Fulton, and R.R. Rando. 1986. a. Mechanism of action of aromatic amines that short-circuit the visual cycle. Biochemistry. 25:3370–3377. - PubMed

Publication types