. 2002 May 27;157(5):807-17.
doi: 10.1083/jcb.200203034. Epub 2002 May 28.

The Rho-associated protein kinase p160ROCK is required for centrosome positioning

Affiliations

The Rho-associated protein kinase p160ROCK is required for centrosome positioning

Véronique Chevrier et al. J Cell Biol. .

Abstract

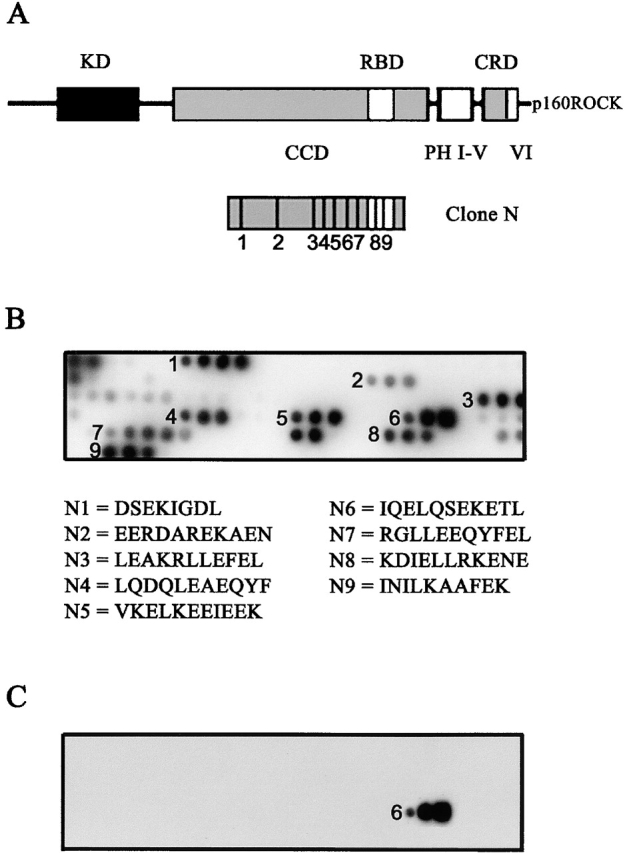
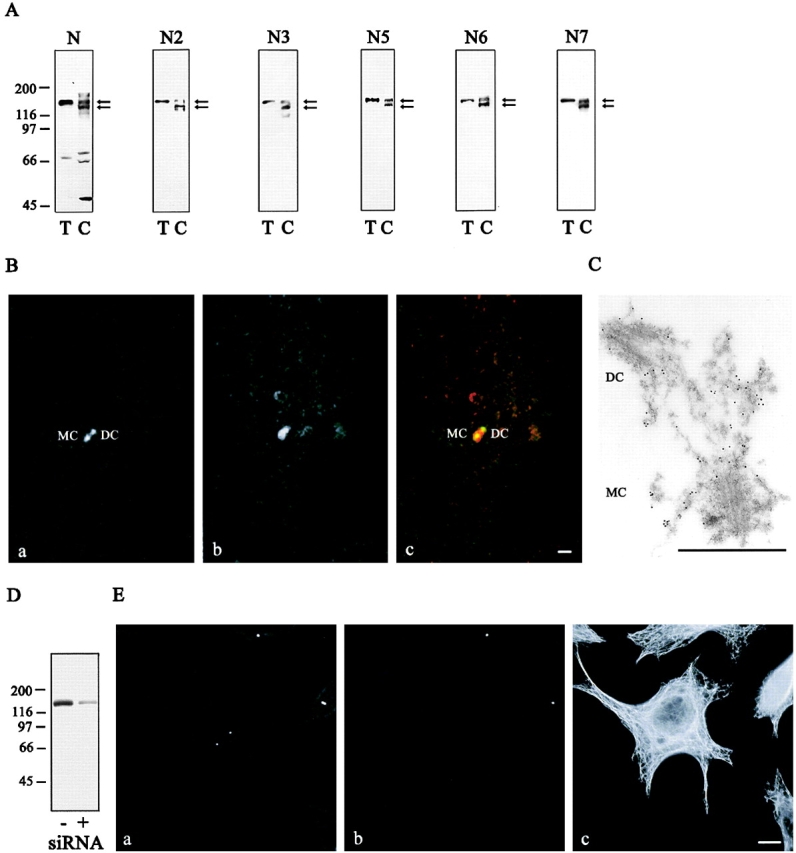
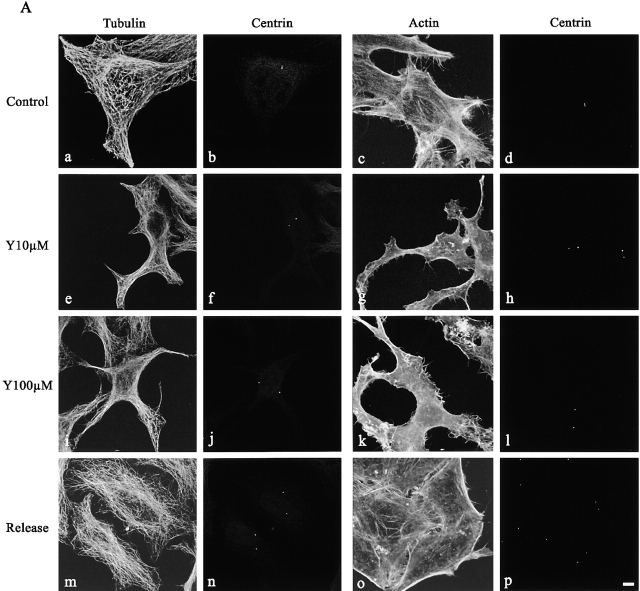
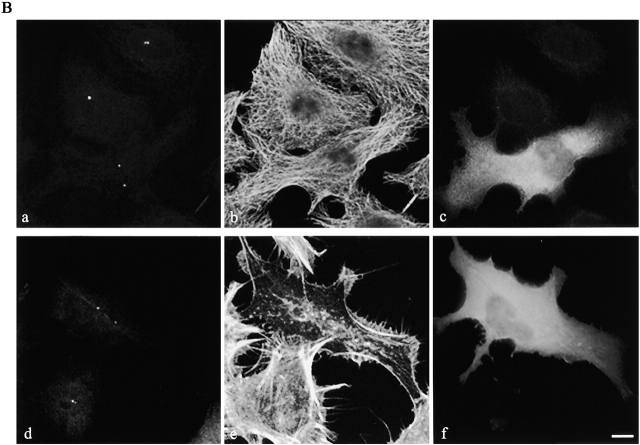
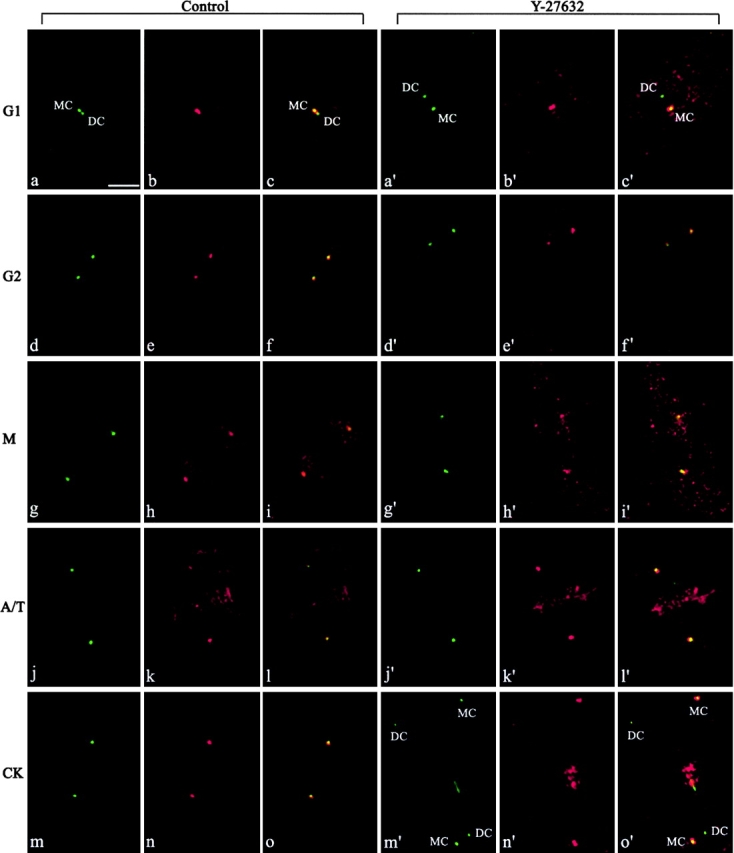
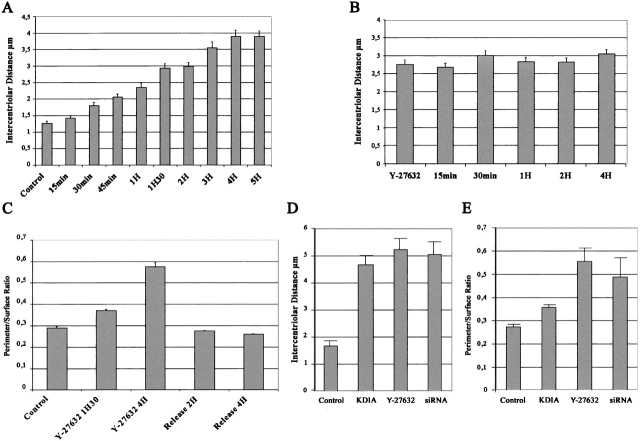
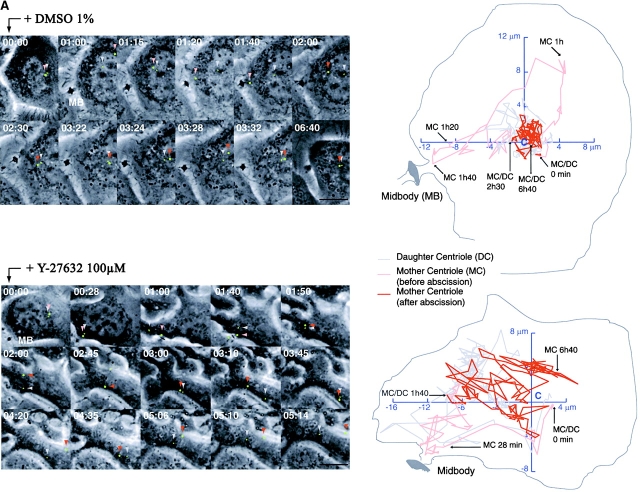
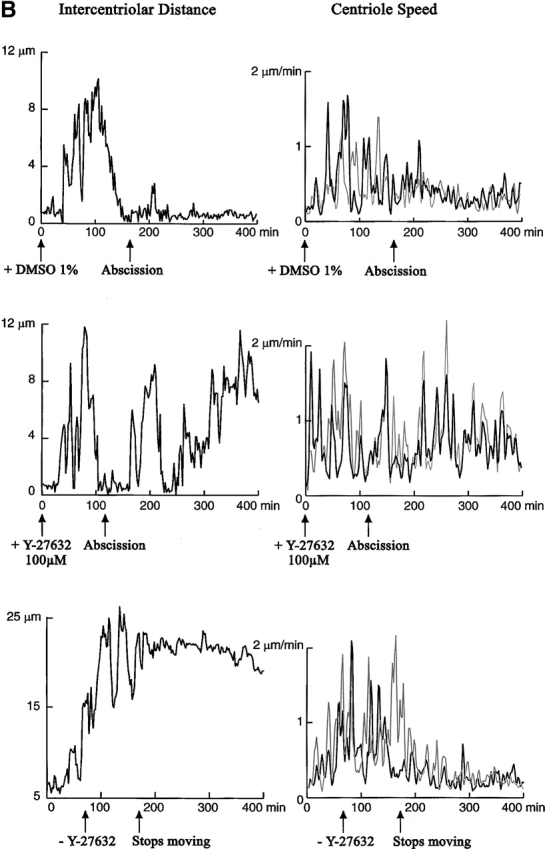
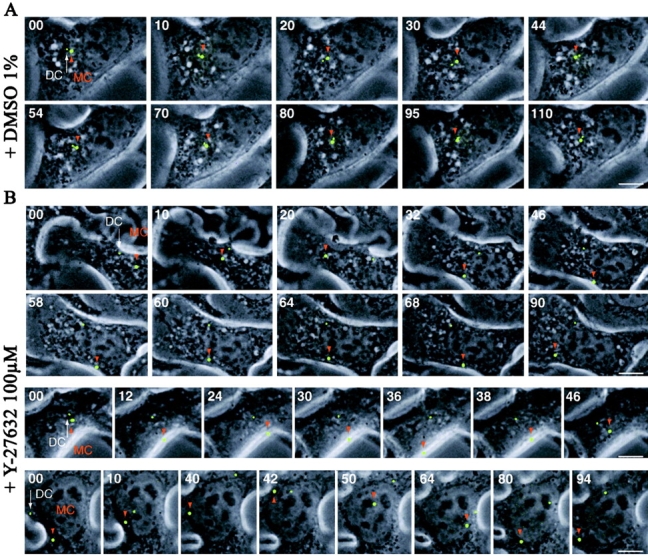
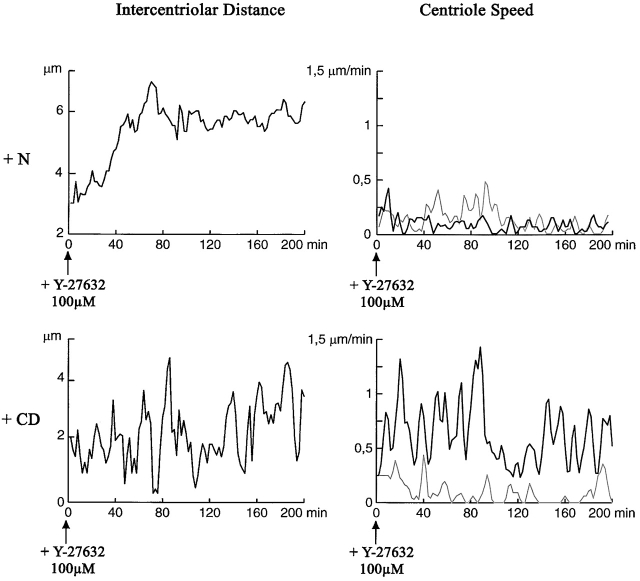
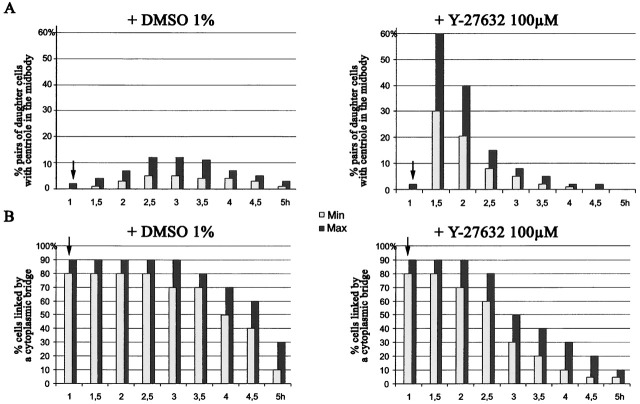
The p160-Rho-associated coiled-coil-containing protein kinase (ROCK) is identified as a new centrosomal component. Using immunofluorescence with a variety of p160ROCK antibodies, immuno EM, and depletion with RNA interference, p160ROCK is principally bound to the mother centriole (MC) and an intercentriolar linker. Inhibition of p160ROCK provoked centrosome splitting in G1 with the MC, which is normally positioned at the cell center and shows little motion during G1, displaying wide excursions around the cell periphery, similar to its migration toward the midbody during cytokinesis. p160ROCK inhibition late after anaphase in mitosis triggered MC migration to the midbody followed by completion of cell division. Thus, p160ROCK is required for centrosome positioning and centrosome-dependent exit from mitosis.


Figures

Figure 1.
Figure 1.
Structure of clone N. (A) Schematic representation of p160ROCK and clone N. p160ROCK (sequence data available from GenBank/EMBL/DDBJ under accession no. U43195) is a 160-kD protein serine/threonine kinase containing a kinase domain (KD), a long amphipathic α-helix capable of forming a coiled-coil structure (CCD) containing a Rho binding domain (RBD), the pleckstrin homology domain (PHI-V, VI) split by a cysteine-rich zinc finger (CRD); clone N (sequence data available from GenBank/EMBL/DDBJ under accession no. AY025529) coded for a protein fragment (protein N) corresponding to amino acids 594–1028. The positions of the nine epitopes recognized by polyclonal antibody directed against protein N (see B) are indicated. (B) Peptide SPOT analysis of the epitopes recognized by protein N polyclonal antibody showing nine positive peptide clusters (1–9). The sequences of the nine corresponding epitope peptides are shown below (N1 to N9). (C) Peptide SPOT analysis of the affinity purified N6 antibody. The affinity purified antibody reacted exclusively with peptide N6.
Figure 2.
Figure 2.
Centrosomal localization of p160ROCK. (A) Immunoblot analysis of total protein extracts from MDBK cells (T) and purified calf thymus centrosomes (C) using antibodies N, N2, N3, N5, N6, and N7. In total cell extracts, the peptide-purified antibodies reacted with a single 160-kD protein corresponding to p160ROCK. In centrosomal fractions, the same antibodies also stained a slightly lower molecular weight protein that may be a proteolytic product of p160ROCK or a centrosomal variant of this protein. (B) Immunostaining of HeLa GFP-centrin cells (a) with N6 antibody (b). The MC and DC were identified based on the centrin signal by conventional fluorescence microscopy examination of the cells. On visual examination, the MC shows distinctly stronger centrin signal than the DC (Piel et al., 2000). This difference is still visible although often less striking in confocal images. Bar, 1 μm. (C) Immuno EM localization of p160ROCK with polyclonal antibody N6 in isolated KE 37 centrosomes showing staining of the PCM, including the intercentriolar linker. Controls run with secondary antibody alone showed a complete absence of staining (unpublished data). Bar, 1 μm. (D) Silencing of p160ROCK: immunoblot analysis of p160ROCK in total cell extracts from either control HeLa cells or from HeLa cells transfected with siRNA n°3 (72 h after transfection), using p160ROCK antibody N6 as a primary antibody. Equal amounts of total cell protein from control and transfected cells were loaded as estimated from Coomassie blue gels (unpublished data). (E) Centrosome staining in HeLa GFP-centrin cells transfected with siRNA: cells were transfected with siRNA n°3. (a) Centriole visualization with GFP-centrin; (b) centriole staining with p160ROCK N6 antibody; (c) microtubule staining with anti–β-tubulin antibody. Changes in cell shape were used as a criteria for p160ROCK depletion. The figure is centered on a cell with abnormal shape, showing absence of centrosome staining with p160ROCK antibodies. The cell was surrounded by cells of normal shape, showing p160ROCK centrosome staining. Bar, 5 μm.
Figure 4.
Figure 4.
Centrosome splitting by p160ROCK inhibition. (A) Immunostaining of HeLa GFP-centrin cells with monoclonal anti–β-tubulin antibody or phalloidin-rhodamine. Untreated cells (a–d); cells treated for 1.5 h with 10 μM Y-27362 (e–h); cells treated with 100 μM Y-27362 for 1.5 h (i–l); cells treated with 100 μM Y-27362 for 1.5 h (m–p) examined 4 h after withdrawal of the drug. Exposure to the drug caused cell shape changes, stress fiber disruption, and centrosome splitting. Centrosome splitting persisted after drug withdrawal. Bar, 5 μm. (B) Immunostaining of HeLa GFP-centrin cells transfected with cMyc-tagged p160ROCK dominant negative KDIA construct. Cells were examined 24 h after transfection. GFP-centrin (a and d); tubulin staining (b); phalloidin-rhodamine staining (e); c-Myc staining (c and f). c-Myc–positive cells showed abnormal shape, stress fiber disruption, and centrosome splitting as Y-27632–treated cells. Bar, 5 μm.
Figure 4.
Figure 4.
Centrosome splitting by p160ROCK inhibition. (A) Immunostaining of HeLa GFP-centrin cells with monoclonal anti–β-tubulin antibody or phalloidin-rhodamine. Untreated cells (a–d); cells treated for 1.5 h with 10 μM Y-27362 (e–h); cells treated with 100 μM Y-27362 for 1.5 h (i–l); cells treated with 100 μM Y-27362 for 1.5 h (m–p) examined 4 h after withdrawal of the drug. Exposure to the drug caused cell shape changes, stress fiber disruption, and centrosome splitting. Centrosome splitting persisted after drug withdrawal. Bar, 5 μm. (B) Immunostaining of HeLa GFP-centrin cells transfected with cMyc-tagged p160ROCK dominant negative KDIA construct. Cells were examined 24 h after transfection. GFP-centrin (a and d); tubulin staining (b); phalloidin-rhodamine staining (e); c-Myc staining (c and f). c-Myc–positive cells showed abnormal shape, stress fiber disruption, and centrosome splitting as Y-27632–treated cells. Bar, 5 μm.
Figure 3.
Figure 3.
Cell cycle changes in the distribution of p160ROCK. Immunofluorescence of HeLa GFP-centrin cells with N6 antibody. Centrioles are visible as green dots (a, a', d, d', g, g', j, j', m, and m'). The red staining corresponds to N6 antibody staining (b, b', e, e', h, h', k, k', n, and n'). Merged images: c, c, f, f', i, i', l, l', o, and o'. Cells are shown in G1 phase (a–c and a'–c'), G2 phase (d–e and d'–e'), metaphase (M; g–i and g'–i'), late anaphase through early telophase (A/T; j–l and j'–l'), and cytokinesis (CK; m–o and m'–o') in the absence (a–o) or presence (a'–o') of the p160ROCK inhibitor Y-27632. The MC and DC were identified as in Fig. 2. Bar, 5 μm.
Figure 5.
Figure 5.
Quantitative analysis of intercentriolar distance and cell shape after p160ROCK inhibition. (A) Average intercentriolar distances in cells treated with 100 μM Y-27632 for the indicated amounts of time. In each condition, the average intercentriolar distance was measured on a minimum number of 200 cells. SEMs are indicated. (B) Average intercentriolar distances in cells treated with 100 μM Y-27632 for 1.5 h and then left to recover for the indicated amounts of time after drug withdrawal. Cell numbers and SEMs are as in A. (C) Perimeter to surface ratios in cells treated with 100 μM Y-27632. Cells were treated with Y-27632 for the indicated amounts of time and then fixed and processed for analysis. In release experiments, cells were treated with 100 μM Y-27632 for 90 min, then the drug was withdrawn, and at the indicated times after release from the drug, cells were fixed for subsequent analysis. In each condition, a minimum of 50 cells was examined. The perimeter to surface ratios showed little dispersion, and in some conditions SEMs were too small to be visible on the figure. (D) Average intercentriolar distances after p160ROCK inhibition with 100 μM Y-27632, KDIA mutant, or siRNA as indicated. Cells were treated with Y-27632 for 4 h before analysis. KDIA-transfected cells were analyzed 24 h after transfection. For siRNA-treated cells, the analysis (48 h after transfection) concerns cells with extinct p160ROCK signal, normal nuclei, and assembled microtubule arrays. In each condition, the average intercentriolar distance was measured on a minimum number of 100 cells. SEMs are indicated. (E) Perimeter to surface ratios after p160ROCK inhibition. Conditions were as in D.
Figure 6.
Figure 6.
Videomicroscopy analysis of Y-27632 effect on centriole motility. Phase–contrast and fluorescence images of postmitotic and G1 Hela cells stably expressing GFP-centrin were recorded every 2 min. Cells were placed in a medium containing either DMSO (control cells) or Y-27632 as indicated. (A) The images on the left are extracted from movies. The corresponding time is indicated on the top left corner of each frame (h:min). An overlay of GFP signal (green) on the corresponding phase–contrast image is shown. The centrioles were spotted by hand with green dots to allow visualization at low magnification. The MC is the bigger one, indicated by a pink arrowhead before midbody rupture and a red arrowhead after midbody rupture. The DC is indicated by a gray arrowhead. Centriole trajectories are drawn on the right with the same color code. The cell margin at the beginning of the movie is indicated by a thin gray line. Thanks to the cytoplasmic fluorescence of the soluble GFP-centrin pool, the cell shape could be tracked automatically, and then the centroide of the cell was calculated for each plane. Centriole position is shown relatively to that centroide, which is thus the point 0 of the coordinates (indicated by C). Y-27632 was added at time 00:00. Bar, 10 μm. (B) The intercentriolar distance and the centriolar speed are plotted over time (gray curve, DC speed). The four top graphs correspond to the cells shown in A. The two bottom graphs correspond to a release experiment: Y-27632 was added 1 h before time 0, and then the cells were filmed during 1 h before the medium was replaced by Y-27632–free medium (three washings). In the case shown, the intercentriolar distance is elevated because the cell was elongated and the centrioles were on both sides of the cells when the drug was removed, resulting in an arrest of centriolar motion. The centrioles never clustered again after drug removal.
Figure 6.
Figure 6.
Videomicroscopy analysis of Y-27632 effect on centriole motility. Phase–contrast and fluorescence images of postmitotic and G1 Hela cells stably expressing GFP-centrin were recorded every 2 min. Cells were placed in a medium containing either DMSO (control cells) or Y-27632 as indicated. (A) The images on the left are extracted from movies. The corresponding time is indicated on the top left corner of each frame (h:min). An overlay of GFP signal (green) on the corresponding phase–contrast image is shown. The centrioles were spotted by hand with green dots to allow visualization at low magnification. The MC is the bigger one, indicated by a pink arrowhead before midbody rupture and a red arrowhead after midbody rupture. The DC is indicated by a gray arrowhead. Centriole trajectories are drawn on the right with the same color code. The cell margin at the beginning of the movie is indicated by a thin gray line. Thanks to the cytoplasmic fluorescence of the soluble GFP-centrin pool, the cell shape could be tracked automatically, and then the centroide of the cell was calculated for each plane. Centriole position is shown relatively to that centroide, which is thus the point 0 of the coordinates (indicated by C). Y-27632 was added at time 00:00. Bar, 10 μm. (B) The intercentriolar distance and the centriolar speed are plotted over time (gray curve, DC speed). The four top graphs correspond to the cells shown in A. The two bottom graphs correspond to a release experiment: Y-27632 was added 1 h before time 0, and then the cells were filmed during 1 h before the medium was replaced by Y-27632–free medium (three washings). In the case shown, the intercentriolar distance is elevated because the cell was elongated and the centrioles were on both sides of the cells when the drug was removed, resulting in an arrest of centriolar motion. The centrioles never clustered again after drug removal.
Figure 7.
Figure 7.
Centriole behavior in G1 HeLa cells. Centrioles are shown as in Fig. 6 A. G1 HeLa cells recorded as in Fig. 6. Time is in minutes. (A) Control cell; the MC stays near the cell center. (B) Three examples of characteristic behaviors of the MC in cells treated with 100 μM of Y-27632: either running along the membrane (first two rows) or turning around the nucleus (last row). Bar, 10 μm.
Figure 8.
Figure 8.
Videomicroscopy analysis of nocodazole and cytochalasin effect on centrosomes in cells treated with Y-27632. The intercentriolar distance and the centriolar speed are plotted over time (gray curve, DC speed). (Top graphs) G1 cells were treated with 5 μM nocodazole (N) and cold for 30 min to depolymerize microtubules and then rewarmed at 37°C and filmed in a medium containing nocodazole and 100 μM Y-27632. (Bottom graphs) Cells were treated with 1 mg/ml CD for 20 min and then filmed in the presence of CD and Y-27632.
Figure 9.
Figure 9.
Synchronization effect of p160 ROCK inhibition on MC movements and abscission. Cells were treated either with 1% DMSO or 100 μM Y-27632 1 h after replating from a mitotic shake off (arrows). Coverslips were then fixed at indicated time points, and the percentages of both daughter cell pairs with centriole in the midbody (A) and cells linked by a cytoplasmic bridge (B) were determined. At least 300 cells were counted for each percentage determination. Four independent experiments were done. The maximum (max) and the minimum (min) values observed are indicated. Percentages do not add up to 100% because centriole localization in the midbody can escape detection and because of the statistical error attached to each percentage determination.

References

    1. Amano, M., Y. Fukata, and K. Kaibuchi. 2000. Regulation and functions of Rho-associated kinase. Exp. Cell Res. 261:44–51. - PubMed
    1. Andersen, S.S.L. 1999. Molecular characteristics of the centrosome. Int. Rev. Cytol. 187:51–109. - PubMed
    1. Bornens, M., M. Paintrand, J. Berges, M.C. Marty, and E. Karsenti. 1987. Structural and chemical characterization of isolated centrosomes. Cell Motil. Cytoskeleton. 8:238–249. - PubMed
    1. Chang, P., and T. Stearns. 2000. δ-Tubulin and ɛ-tubulin: two new human centrosomal tubulins reveal new aspects of centrosome structure and function. Nat. Cell Biol. 2:30–35. - PubMed
    1. Chevrier, V., S. Komesli, A.C. Schmit, M. Vantard, A.M. Lambert, and D. Job. 1992. A monoclonal antibody, raised against mammalian centrosomes and screened by recognition of plant microtubule organizing centers, identifies a pericentriolar component in different cell types. J. Cell Sci. 101:823–835. - PubMed

Publication types

Substances