. 2002 Jun 1;30(11):2261-9.
doi: 10.1093/nar/30.11.2261.

Replicational organization of three weakly expressed loci in Physarum polycephalum

Affiliations

Replicational organization of three weakly expressed loci in Physarum polycephalum

Chrystelle Maric et al. Nucleic Acids Res. .

Abstract

We previously mapped early-activated replication origins in the promoter regions of five abundantly transcribed genes in the slime mold Physarum polycephalum. This physical linkage between origins and genes is congruent with the preferential early replication of the active genes in mammalian cells. To determine how general this replicational organization is in the synchronous plasmodium of Physarum, we analyzed the replication of three weakly expressed genes. Bromodeoxyuridine (BrdUrd) density-shift and gene dosage experiments indicated that the redB (regulated in development) and redE genes replicate early, whereas redA replicates in mid-S phase. Bi-dimensional gel electrophoresis revealed that redA coincides with an origin that appears to be activated within a large temporal window in S phase so that the replication of the gene is not well defined temporally. The early replication of the redB and redE genes is due to the simultaneous activation of flanking origins at the onset of S phase. As a result, these two genes correspond to termination sites of DNA replication. Our data demonstrate that not all the Physarum promoters are preferred sites of initiation but, so far, all the expressed genes analyzed in detail either coincide with a replication origin or are embedded into a cluster of early firing replicons.


Figures

Figure 1
Figure 1
Comparative analysis of mRNA abundance from the red genes and from abundantly transcribed genes in the plasmodium. Multiple lanes of a single northern blot, each containing 10 µg of total RNA from a G2-phase plasmodium, were hybridized with probes corresponding either to the actin ardC, profilin proP and histone H4-1 genes or to the red genes. As a control for probe efficiency, each northern strip was co-hybridized with a Southern blot lane containing 3 µg of DNA and restricted such that DNA fragments of sizes between 5 kb (EcoRI digest, proP probe) and 10 kb (EcoRI digest, H4-1 probe) were recognized (not shown). Measurement of signal intensities by PhosphorImaging on DNA blot revealed that probe efficiency was within a range of 2. Signals on northern blot were normalized to these values to determine the relative mRNA levels shown in the histograms. Exposure was for 1 day for all samples except for redE which required 10 days. Sizes of the mRNAs extend from 480 nt for H4-1 to 1.4 kb for ardC.
Figure 2
Figure 2
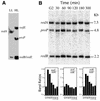
Temporal order of replication of the red genes. (A) BrdUrd density-shift analysis. Following in vivo BrdUrd incorporation during the first 45 min of S phase, LL and HL EcoRI-digested DNA fractions were purified on a CsCl gradient and analyzed by Southern blotting. Four different radioactive probes, one of which corresponds to the early replicating proP gene as a control, were mixed in the hybridization solution. The EcoRI fragments containing proP, redE and redB are enriched in the HL DNA fraction and therefore replicated early, whereas redA is not replicated by 45 min in S phase. (B) ‘Gene dosage’ analysis. A Southern blot of EcoRI-digested synchronous DNA samples was hybridized with a mixture of the redA, redB and proP probes. The intensity of the hybridization bands was measured by PhosphorImaging. In each pairwise comparison, the ratio of the G2-phase DNA sample was set to 1.0 and values for the other time points were normalized to this value (see histograms). The proP gene was included in this experiment as an indicator of early replication. Histograms of relative values indicate that proP and redB are both replicated in the first 30 min of the 3 h long S phase, whereas redA replicates in mid-S phase (mainly in the 60–90 min interval).
Figure 3
Figure 3
Kinetics of replication at the redB locus: a two-dimensional gel analysis. Localization of replication forks in four restriction fragments (AD) was deduced from two-dimensional gel patterns. The polarity of fork progression was inferred from evolution of the hybridization signals in DNA extracted from three plasmodia (from left to right) at +5, +10 and +15 min after the onset of S phase. Polarity is shown by arrowheads above the restriction fragment for the rightward-moving fork and below the restriction fragment for the leftward-moving fork. The box symbolizes the gene position within each restriction fragment. The arrow indicates the transcription initiation site and the direction of transcription. At +5 min, forks appear in the A and D fragments, suggesting entry from outside the locus. The progressive convergence of forks from the flanking origins at +10 and +15 min leads to fork collision when both origins fire on the same chromatid. The termination signal in fragment C at +15 min (arrow within the frame) demonstrates merging of forks at the 3′ end of the redB gene. The lack of small Y structures in (D) at +10 min is the result of a transfer artefact.
Figure 4
Figure 4
Fork direction analysis in the redB locus. On the left, the map under the frame indicates the position of the redB gene and of the KpnI site within the HincII fragment (K, KpnI; H, HincII). In-gel digestion with KpnI prior to the second dimension was used to show forks moving in either direction in this fragment (fragment C in Fig. 3). Right, interpretative drawing underlines replication intermediates generated by forks moving rightward (arc 1) and leftward (arc 2). Note that the termination signal (spike 3) is only found associated with arc 2, suggesting different efficiencies of the flanking origins. See scheme of fork movements under the drawing where on and off refer to the deduced activity of the upstream and downstream origin. Because of overlapping signals, it was not possible to determine the abundance ratio of type 2 and type 3 events. However, PhosphorImaging quantification indicated a similar frequency for events 1 and 2+3.
Figure 5
Figure 5
Replicon organization at the redE locus. (A) The restriction map depicts the 16 kb region under study. The position of the gene and the polarity of transcription are indicated. Restriction sites are as follows: E, EcoRI, K, KpnI and H, HindIII. The cell cycle stage of the synchronous DNA sample is indicated. A replication origin on the 3′ side of the gene is evidenced by the prominent bubble arc in the 6.5 kb KpnI fragment at +5 min. In the overlapping 7.5 kb HindIII fragment, only a partial Y arc is seen at the onset of S phase. However, probing the 8.5 kb EcoRI fragment, which extends only 1 kb more on the 5′ side, resulted in a distinct bubble arc (arrow within the frame), above the apex of a partial Y arc. This demonstrates the presence of another early firing origin upstream of the redE gene. (B) The scheme depicts the location of the two initiation sites flanking the redE gene and the predicted replication events if the two origins fire on the same chromatids. The 5 and 10 kb allelic fragments of a BclI digest are separated on the two-dimensional gel (see fragments a and b in the restriction map; the polymorphic BclI site is marked B*). The two-dimensional gel pattern reveals a termination signal (arrows within the frame) for each of the two alleles, indicating merging of forks within the promoter region of the gene.
Figure 6
Figure 6
An origin of replication linked to the mid-S-phase replicating redA gene. The replication of the 8.5 kb BamHI (B) fragment of the redA gene was studied between +15 and +135 min in S phase. An origin of replication located within the central third of this fragment is shown by a bubble arc in the +35 to +90 min DNA samples (arrows). Replication of the overlapping downstream EcoRI (E) and HindIII (H) fragments (see restriction map) generates simple Y structures (data not shown), indicating no initiation within the central third of these fragments. This further limits the location of the origin to a 2 kb region (represented by the size of the bubble), coinciding with the upstream region of the gene. Quantitation of replication intermediates, as measured by PhosphorImaging, is indicated below the frame for each DNA sample. Surprisingly, the percentage of replicating fragments is relatively constant during a broad temporal window in mid-S phase (+40–90 min).

Similar articles

Cited by

References

    1. Simon I. and Cedar,H. (1996) Temporal order of DNA replication. In DePamphilis,M.L. (ed.), DNA Replication in Eukaryotic Cells. Cold Spring Harbor Laboratory Press, Cold Spring Harbor, NY, pp. 387–408.
    1. Tada S., Li,A., Maiorano,D., Mechali,M. and Blow,J.J. (2001) Repression of origin assembly in metaphase depends on inhibition of RLF-B/Cdt1 by geminin. Nature Cell Biol., 3, 107–113. - PMC - PubMed
    1. Wohlschlegel J.A., Dwyer,B.T., Dhar,S.K., Cvetic,C., Walter,J.C. and Dutta,A. (2000) Inhibition of eukaryotic DNA replication by geminin binding to Cdt1. Science, 290, 2309–2312. - PubMed
    1. Nguyen V.Q., Co,C. and Li,J.J. (2001) Cyclin-dependent kinases prevent DNA re-replication through multiple mechanisms. Nature, 411, 1068–1073. - PubMed
    1. Diffley J.F. (2001) DNA replication: building the perfect switch. Curr. Biol., 11, R367–R370. - PubMed

Publication types