. 2002 Jun 1;30(11):2575-87.
doi: 10.1093/nar/30.11.2575.

Tracing the evolution of RNA structure in ribosomes

Affiliations

Tracing the evolution of RNA structure in ribosomes

Gustavo Caetano-Anollés. Nucleic Acids Res. .

Abstract

The elucidation of ribosomal structure has shown that the function of ribosomes is fundamentally confined to dynamic interactions established between the RNA components of the ribosomal ensemble. These findings now enable a detailed analysis of the evolution of ribosomal RNA (rRNA) structure. The origin and diversification of rRNA was studied here using phylogenetic tools directly at the structural level. A rooted universal tree was reconstructed from the combined secondary structures of large (LSU) and small (SSU) subunit rRNA using cladistic methods and considerations in statistical mechanics. The evolution of the complete repertoire of structural ribosomal characters was formally traced lineage-by-lineage in the tree, showing a tendency towards molecular simplification and a homogeneous reduction of ribosomal structural change with time. Character tracing revealed patterns of evolution in inter-subunit bridge contacts and tRNA-binding sites that were consistent with the proposed coupling of tRNA translocation and subunit movement. These patterns support the concerted evolution of tRNA-binding sites in the two subunits and the ancestral nature and common origin of certain structural ribosomal features, such as the peptidyl (P) site, the functional relay of the penultimate stem helix of SSU rRNA, and other structures participating in ribosomal dynamics. Overall results provide a rare insight into the evolution of ribosomal structure.


Figures
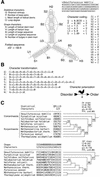
Figure 1
Figure 1
Phylogenetic analysis of molecular structure. The structures from extant RNA molecules can be organized hierarchically in nested sets using cladistic principles. This involves three intimately related processes that are illustrated here by the analysis of archaeal 5S rRNA. (A) Discovery and coding of characters. RNA sequences are folded using kinetic, genetic or energy minimization algorithms, or according to a structural model (64). The resulting structures can be characterized by molecular attributes such as nucleotide length of distinguishing features, thermodynamic properties such as minimum Gibbs free energy increments (ΔG°), and statistical parameters that describe the shape, stability and uniqueness of folded conformations (28,65). In cladistics, attributes are known as ‘characters’ and the numerical values (and frequency distributions of values) they display constitute ‘character states’ (8). 5S rRNA structures from archaeal species (exemplified by Desulfurococcus mobilis) were characterized by two different sets of characters, one describing quantitatively the statistical properties of molecules and the other describing their molecular shape. Shannon entropy of the base-pairing probability matrix (Q) and base-pairing propensity (P) are normalized to sequence length. Q measures the number of conflicting interactions (frustration) that occur during folding (perfectly defined structure: Q = 0; no preferred structure: Q = 1). Characters need to be appropriately coded (i.e. converted into a discrete alphanumerical format) to be cladistically useful. For example, statistical character states are continuous variables that need to be gap-recoded into discrete data to provide maximum phylogenetic signal [e.g. Q values range from 0.0235 (D.mobilis; coded as 1) to 0.1930 (Haloferax volcanii; coded as C)]. Finally, useful characters are only those that can be compared in different structures and are homologous (i.e. share common ancestry). Homology is tested by topographic correspondence (e.g. identifying the same arrangement of stem tracts S1, S2 and S3 in all archaeal molecules; coaxial stems are highlighted) and empirically by phylogenetic reconstruction (21). (B) Character transformation and evolution. The structural characters described here transform from one state to another through time and do so in linearly ordered and reversible pathways called ‘transformation series’. However, an evolutionary direction of transformation (described by a weathercock’s arrow) can be superimposed on these pathways when the ancestral state is identified. This ‘polarization’ of character transformation is driven by an evolutionary search for structural order [which is well supported by concepts in statistical mechanics (–32)]. Polarized pathways can be effectively described using ‘step matrices’ that assign a transformation cost (measured in ‘steps’ or probabilities) to every change. These step matrices help optimize the interplay between phylogenetic analysis and the evolutionary model (see Fig. 3). (C) Reconstruction of phylogenetic trees. In this process, hypotheses about character state (models of structural evolution) result into hypotheses about groups of molecules (hierarchical phylogenies). Using discrete methods, trees are chosen to be those that require either the fewest evolutionary changes (maximum parsimony) or are most likely to happen (maximum likelihood) (8). In this example, phylogenetic trees are reconstructed using the criterion of parsimony by minimizing the total cost of character change. Data matrices show how archaeal characters and molecules display character states. They were used to reconstruct most-parsimonious rooted trees in exhaustive searches. Characters were equally weighted except for stems that were weighted double to account for nucleotide number. Each analysis produced single optimal trees with similar topologies. BS support values indicate how robust are individual groups. I have here chosen the maximum parsimony method because it is one of the few that explicitly seeks the reconstruction of ancestral molecules. CI, consistency index. RI, retention index.
Figure 2
Figure 2
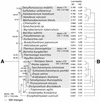
Phylogenetic reconstruction of a universal tree based on the combined secondary structures of LSU and SSU rRNA. (A) Single most-parsimonious tree (13 233 steps; CI = 0.477, RI = 0.708; g1 = –0.467; PTP test, p = 0.001) retained after a heuristic search with TBR branch swapping and 50 replicates of random addition sequence. A total of 647 LSU and 383 SSU rRNA informative characters representing the structure of both subunits were combined and analyzed. The reduced tree shows branches with <50% BS collapsed into polytomies, nodes described by BS proportions and DD indexes (in italics), and maximum leaf stabilities from BS and decay analyses (for 1244 rooted trees). Decay and cladistic information content (CIC) values describe the global tree and the most supported and comprehensive topologies. (B) Strict consensus tree resulting from combining universal trees obtained from individual rRNA subunit structures. The trees had 8892 and 3690 steps and shared 2337 out of 3654 triplets.
Figure 3
Figure 3
Modeling character evolution. (A) Bubble chart describing the average frequency of changes between states in helix stacks and unpaired segments. (B) Reconstruction of a universal tree using a characters state matrix that was inferred from probabilities of character change. A single most-parsimonious tree (10 964 steps; g1 = –0.536; PTP test, p = 0.001) retained after a heuristic search with TBR branch swapping and 10 replicates of random addition sequence was obtained. A total of 302 helix and 721 unpaired characters were included in the analysis. The reduced tree shows branches with <50% BS collapsed into polytomies and BS proportions.
Figure 4
Figure 4
Phylogenetic tracing of rRNA structure. (A) Schematic representations of the secondary structure of inferred ancestral rRNA subunit molecules. The LSU and SSU structures contain 100 and 50 universal helical segments (S; defined as segments separated by multibranched or pseudoknot loops), respectively, and several other S specific to certain taxa (58). Sequences are drawn clockwise from the 5′ to the 3′ terminus and S tracts (depicted by bars sized in base pairs) are numbered in the same order for each structural LSU domain (A–I), and globally, for the 5′ (helices 1–21), central (22–31) and 3′ domains (32–50) in SSU. The location of inter-subunit bridges (gray), and P (red), A (blue) and E sites (cyan) are highlighted in the ancestral structures. (B) The evolution of characters defining total and functional rRNA structures was traced on the dichotomous universal tree described in Figure 1A. Pie charts are sized by area and describe changes in functional characters occurring in basal branches and major clades.
Figure 5
Figure 5
Phylogenetic relationships between tRNA-binding sites and inter-subunit bridges. (A) Ribosomal outline of an interface view of rRNA subunits, showing location of proteins (light yellow), tRNA (in LSU) or tRNA-binding sites (in SSU), and bridge contacts. Highlighted in gray are dominant structural components of the subunit interface, SSU helix 49, co-axial LSU helices E25–E28, and the flexible bridge component E26 (harboring contact B2a). (B) Phylogenetic reconstruction of relationships between bridge contacts and tRNA-binding sites in each rRNA subunit. Multi-state characters were defined by Ni values for the universal tree and its major clades (Archaea, Bacteria, Eucarya and the tree base), normalized to leaf number. An exhaustive search resulted in three most-parsimonious trees (57 steps; CI = 0.702, RI = 0.653; g1 = –0.537; PTP test, p = 0.01). The reduced tree shows branches with <50% BS collapsed into polytomies, nodes described by BS proportions and DD indexes (in italics), and maximum leaf stabilities. (C) Detailed phylogenetic relationships between bridge contacts and tRNA-binding sites. Two trees (204 steps; CI = 0.392, RI = 0.660; g1 = –0.443; PTP test, p = 0.01) were retained after a branch-and-bound search. Note that trees shown in (B) and (C) are congruent with the 50% majority rule consensus. The existence of character change was traced as indexed in the legend, and is shown for selected branches.
Figure 6
Figure 6
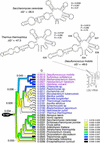
Tracing the molecular plasticity of the E24–E28 structure that supports ‘flexible’ contact B2a in the universal tree. Representative molecular substructures (124–150 nt in length) in Archaea, Bacteria and Eucarya are given from bottom to top. Minimum Gibbs free energy increments (ΔG°) for the folds ranged from –18.8 (Tetrahymena thermophila) to –65.8 kcal/mol (Thermotoga maritima). Shannon entropy (Q) values that measure the uniqueness of folded conformations, together with other statistical properties, were calculated for the individual substructures. Square root parsimony was then used to reconstruct ancestral Q states as continuous characters in the universal tree, using MacClade with the rooted tree option. A mean of corresponding permuted cohorts obtained by sequence randomization is shown at the base of the tree. Since at Q = 1 there is no preferred structure, the relatively low value of randomized sequences demonstrates once more the importance of self-organization in evolution (–32).

References

    1. Green R. and Noller,H.F. (1997) Ribosomes and translation. Annu. Rev. Biochem., 66, 679–716. - PubMed
    1. Cate J.H., Yusupov,M.M., Yusupova,G.Z., Earnest,T.N. and Noller,H.F. (1999) X-ray crystal structure of 70S ribosome functional complexes. Science, 285, 2095–2104. - PubMed
    1. Ban N., Nissen,P., Hansen,J., Moore,P.B. and Steitz,T.A. (2000) The complete atomic structure of the large ribosomal subunit at 2.4 Å resolution. Science, 289, 905–920. - PubMed
    1. Wimberly B.T., Brodersen,D.E., Clemons,W.M.,Jr, Morgan-Warren,R.J., Carter,A.P., Vonrhein,C., Hartsch,T. and Ramakrishnan,V. (2000) Structure of the 30S ribosomal subunit. Nature, 407, 306–307. - PubMed
    1. Schluenzen F., Tocilj,A., Zarivach,R., Harms,J., Gluehmann,M., Janell,D., Bashan,A., Bartels,H., Agmon,I., Franceschi,F. and Yonath,A. (2000) Structure of functionally activated small ribosomal subunit at 3.3 Å resolution. Cell, 102, 615–623. - PubMed

Publication types