. 2002 Jun 11;99(12):8191-6.
doi: 10.1073/pnas.112515399. Epub 2002 May 28.

Constitutive telomerase expression promotes mammary carcinomas in aging mice

Affiliations

Constitutive telomerase expression promotes mammary carcinomas in aging mice

Steven E Artandi et al. Proc Natl Acad Sci U S A. .

Abstract

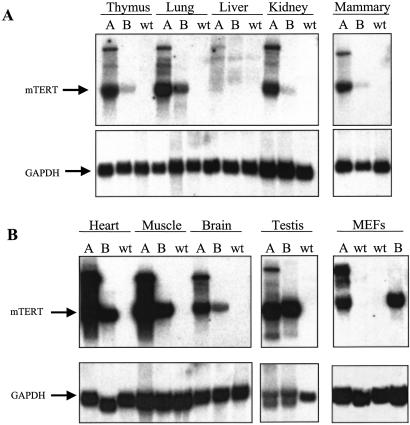
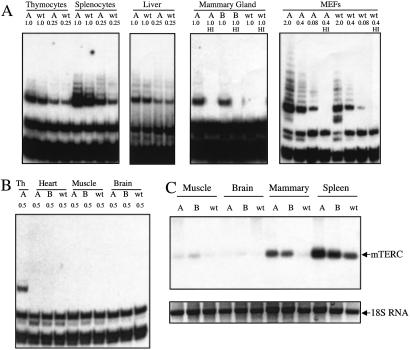
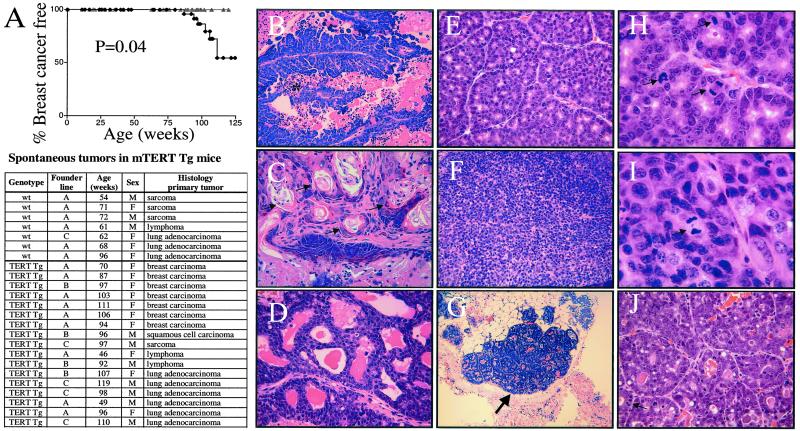
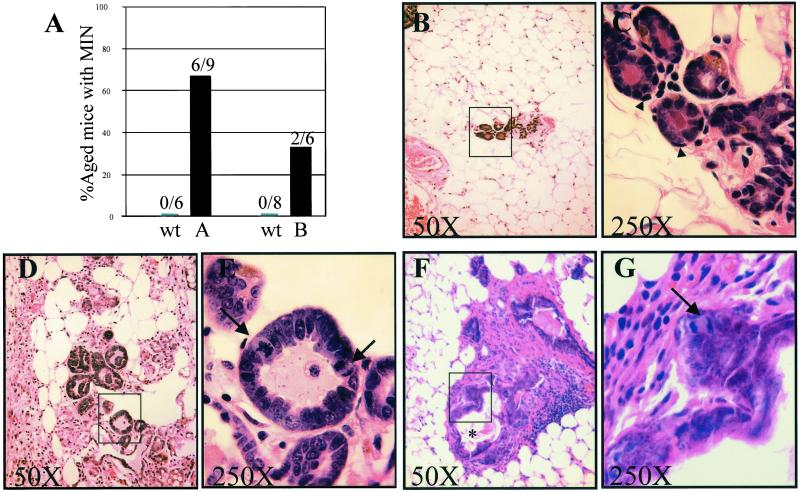
Telomerase is up-regulated in the vast majority of human cancers and serves to halt the progressive telomere shortening that ultimately blocks would-be cancer cells from achieving a full malignant phenotype. In contrast to humans, the laboratory mouse possesses long telomeres and, even in early generation telomerase-deficient mice, the level of telomere reserve is sufficient to avert telomere-based checkpoint responses and to permit full malignant progression. These features in the mouse provide an opportunity to determine whether enforced high-level telomerase activity can serve functions that extend beyond its ability to sustain telomere length and function. Here, we report the generation and characterization of transgenic mice that express the catalytic subunit of telomerase (mTERT) at high levels in a broad variety of tissues. Expression of mTERT conferred increased telomerase enzymatic activity in several tissues, including mammary gland, splenocytes, and cultured mouse embryonic fibroblasts. In mouse embryonic fibroblasts, mTERT overexpression extended telomere lengths but did not prevent culture-induced replicative arrest, thus reinforcing the view that this phenomenon is not related to occult telomere shortening. Robust telomerase activity, however, was associated with the spontaneous development of mammary intraepithelial neoplasia and invasive mammary carcinomas in a significant proportion of aged females. These data indicate that enforced mTERT expression can promote the development of spontaneous cancers even in the setting of ample telomere reserve.


Figures

Figure 1
Figure 1
Northern blot showing TERT mRNA expression in tissues of mTERT Tg mice. Twenty micrograms of total RNA were analyzed for each tissue except mammary gland, for which 10 μg was used. Samples included thymus, lung, liver, kidney, mammary gland (A), heart, skeletal muscle, brain, testis, and MEFs (B). For each organ, RNA was isolated from founder line A mTERT Tg mice, founder line B mTERT Tg mice, and from non-Tg controls (wt, wild type). The membranes were first probed for mTERT then stripped and reprobed for glyceraldehyde-3-phosphate dehydrogenase (GAPDH) as a loading control.
Figure 2
Figure 2
Telomerase activity and mTERC RNA levels in tissues and cells from mTERT Tg mice. (A) TRAP assays on extracts from thymocytes, splenocytes, and liver from A line mTERT Tg mice and non-Tg littermate controls. Amount of extract is indicated in micrograms. Untreated or heat-inactivated (HI) extracts (1 μg) from virgin A and B line mTERT Tg and wild-type (wt) control mammary glands were assayed for TRAP activity. Five-fold serial dilutions and HI extract were assayed for mTERT Tg or wt littermate MEFs. (B) Lack of telomerase activity in Tg heart, skeletal muscle, and brain. Amount of extract is indicated. Thymocytes were used as a positive control. (C) Northern blot analysis of steady-state mTERC levels. Twenty micrograms of total RNA was analyzed from skeletal muscle, brain, mammary gland, and spleen from A and B line mTERT Tg mice and non-Tg controls. A photograph of ethidium bromide-stained 18S RNA is shown as a loading control.
Figure 3
Figure 3
Telomere lengths and proliferation assays for MEFs and hematopoietic cells. (A) Terminal restriction fragments from mTERT Tg MEFs or non-Tg littermate MEFs were resolved by field inversion gel electrophoresis. MEF cultures were from littermate embryos from the A mTERT Tg line (lanes 1–3) and the B Tg line (lanes 4–7). (B) Mean telomere lengths are shown in adjacent bar graph, 50 kb non-Tg mice and 70 kb for TERT Tg littermates (P = 0.018 by Student's t test). (C) 3T9 assay on independent MEF cultures from wild-type embryos (gray circles) and littermate TERT Tg embryos (black triangles). Each point represents the mean of 13 independent cultures from mTERT Tg MEFs (7 from line A and 6 from line B) or the mean of 12 independent cultures from littermate non-Tg controls. Mitogen proliferation assays from thymocytes and splenocytes (D) and bone marrow cells (E). Cells were stimulated with the indicated mitogens and proliferation was assayed by measuring incorporation of [3H]thymidine. Each bar represents the mean of triplicates. Error bars show SD.
Figure 4
Figure 4
TERT transgene expression promotes breast cancer in aging mice. (A) Kaplan–Meier analysis of breast cancer incidence in female mice, mTERT Tg (black diamonds), and non-Tg littermate controls (gray triangles). Tumor spectrum in aging mice (Table). (BJ) Histopathology of breast cancers in mTERT Tg mice. Representative histologic patterns of papillary (B), adenosquamous (C), cribiform (D), acinar (E and H), and solid (F and I) invasive breast cancers and preinvasive MIN lesions (G and J) are shown. In B, * indicates necrosis. In C, arrows indicate areas of squamous differentiation. In G, the large arrow indicates an in situ lesion. In HJ, the arrows indicate mitotic figures. Magnification: ×25 (G), ×100 (BF and J), and ×250 (H and I).
Figure 5
Figure 5
High penetrance of MIN in mTERT Tg mammary glands. (A) Bar graph indicating penetrance of MIN in virgin female mTERT Tg (black bars) and non-Tg age-matched littermate control mice (gray bars). MIN lesions were seen in 6/9 A line mTERT Tg mice compared with 0/6 non-Tg control mice (left bars, age range 92–114 weeks). MIN lesions were found in 2/6 B line mTERT Tg mice compared with 0/8 non-Tg mice (right bars, mean age 60 weeks). (B and C) Normal mammary tissue from aged non-Tg mouse. (D and E) Histology of MIN lesion in aged A line mTERT Tg mouse. Note that the cells are enlarged and pleiomorphic with hyperchromatic nuclei, increased N/C ratios, and elevated mitotic activity (arrows in E). The glands in the MIN lesion lack the normal basal cell layer seen in the non-Tg sample (arrowheads in C). (F and G) Histology of MIN lesion in B line mTERT Tg mouse. Note the thickened epithelial layers, stromal proliferation, necrosis (asterisk, F), and mitotic figures (arrow, G). Magnification: ×25 (B, D, and F) and ×100 (C, E, and G).

References

    1. Hastie N D, Dempster M, Dunlop M G, Thompson A M, Green D K, Allshire R C. Nature (London) 1990;346:866–868. - PubMed
    1. Rudolph K L, Chang S, Millard M, Schreiber-Agus N, DePinho R A. Science. 2000;287:1253–1258. - PubMed
    1. Harley C B, Futcher A B, Greider C W. Nature (London) 1990;345:458–460. - PubMed
    1. Kim N W, Piatyszek M A, Prowse K R, Harley C B, West M D, Ho P L, Coviello G M, Wright W E, Weinrich S L, Shay J W. Science. 1994;266:2011–2015. - PubMed
    1. Blackburn E H. Nature (London) 2000;408:53–56. - PubMed

Publication types

LinkOut - more resources