

Rapid and quantitative detection of the microbial spoilage of meat by fourier transform infrared spectroscopy and machine learning
- PMID: 12039738
- PMCID: PMC123922
- DOI: 10.1128/AEM.68.6.2822-2828.2002
Rapid and quantitative detection of the microbial spoilage of meat by fourier transform infrared spectroscopy and machine learning
Abstract
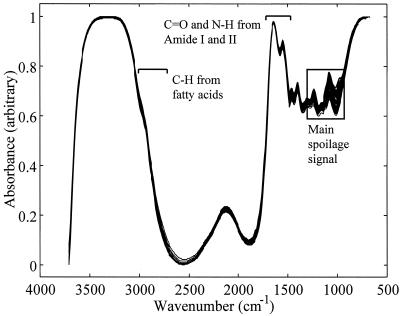
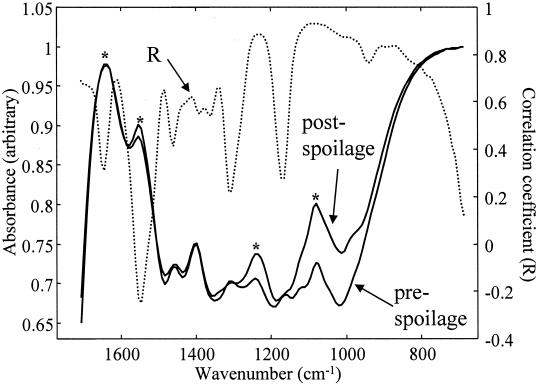
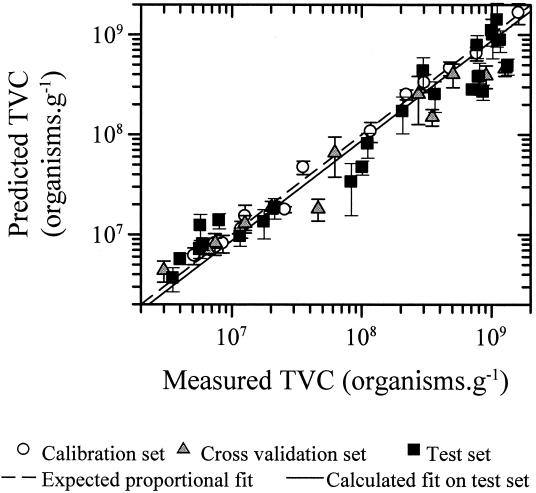
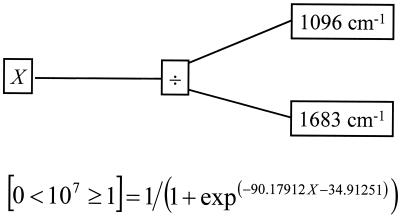
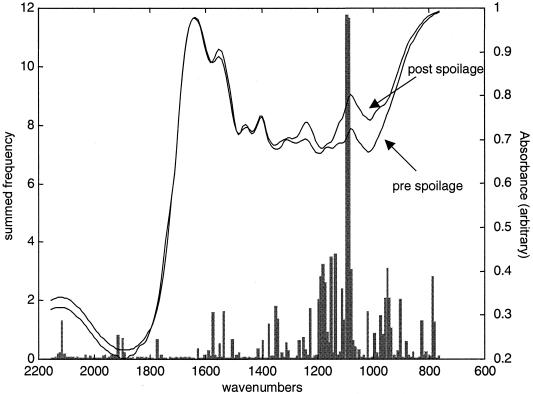
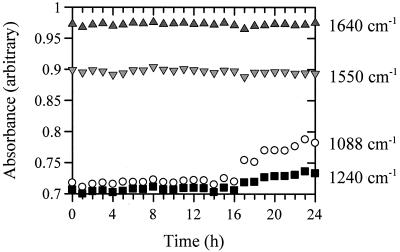
Fourier transform infrared (FT-IR) spectroscopy is a rapid, noninvasive technique with considerable potential for application in the food and related industries. We show here that this technique can be used directly on the surface of food to produce biochemically interpretable "fingerprints." Spoilage in meat is the result of decomposition and the formation of metabolites caused by the growth and enzymatic activity of microorganisms. FT-IR was exploited to measure biochemical changes within the meat substrate, enhancing and accelerating the detection of microbial spoilage. Chicken breasts were purchased from a national retailer, comminuted for 10 s, and left to spoil at room temperature for 24 h. Every hour, FT-IR measurements were taken directly from the meat surface using attenuated total reflectance, and the total viable counts were obtained by classical plating methods. Quantitative interpretation of FT-IR spectra was possible using partial least-squares regression and allowed accurate estimates of bacterial loads to be calculated directly from the meat surface in 60 s. Genetic programming was used to derive rules showing that at levels of 10(7) bacteria.g(-1) the main biochemical indicator of spoilage was the onset of proteolysis. Thus, using FT-IR we were able to acquire a metabolic snapshot and quantify, noninvasively, the microbial loads of food samples accurately and rapidly in 60 s, directly from the sample surface. We believe this approach will aid in the Hazard Analysis Critical Control Point process for the assessment of the microbiological safety of food at the production, processing, manufacturing, packaging, and storage levels.
Figures
References
-
- Alomirah, H. F., B. F. Gibbs, and Y. Konishi. 1998. Identification of proteolytic products as indicators of quality in whole and ground meat. J. Food Qual. 21:299-316.
-
- Alsberg, B. K., R. Goodacre, J. J. Rowland, and D. B. Kell. 1997. Classification of pyrolysis mass spectra by fuzzy multivariate rule induction—comparison with regression, K-nearest neighbour, neural and decision-tree methods. Anal. Chim. Acta 348:389-407.
-
- Archer, D. L. 1996. The validation of rapid methods in food microbiology. Food Control 7:3-4.
-
- Bäck, T., D. B. Fogel, and Z. Michalewicz. 1997. Handbook of evolutionary computation. Oxford University Press, Oxford, United Kingdom.
-
- Banwell, C. N., and E. M. McCash. 1994. Fundamentals of molecular spectroscopy, 4th ed. McGraw-Hill, London, United Kingdom.
Publication types
MeSH terms
LinkOut - more resources
Full Text Sources
Other Literature Sources
Medical
