. 2002 Jun 1;22(11):4249-63.
doi: 10.1523/JNEUROSCI.22-11-04249.2002.

Spatiotemporal features of early neuronogenesis differ in wild-type and albino mouse retina

Collaborators, Affiliations

Spatiotemporal features of early neuronogenesis differ in wild-type and albino mouse retina

Rivka A Rachel et al. J Neurosci. .

Abstract

In albino mammals, lack of pigment in the retinal pigment epithelium is associated with retinal defects, including poor visual acuity from a photoreceptor deficit in the central retina and poor depth perception from a decrease in ipsilaterally projecting retinal fibers. Possible contributors to these abnormalities are reported delays in neuronogenesis (Ilia and Jeffery, 1996) and retinal maturation (Webster and Rowe, 1991). To further determine possible perturbations in neuronogenesis and/or differentiation, we used cell-specific markers and refined birth dating methods to examine these events during retinal ganglion cell (RGC) genesis in albino and pigmented mice from embryonic day 11 (E11) to E18. Our data indicate that relative to pigmented mice, more ganglion cells are born in the early stages of neuronogenesis in the albino retina, although the initiation of RGC genesis in the albino is unchanged. The cellular organization of the albino retina is perturbed as early as E12. In addition, cell cycle kinetics and output along the nasotemporal axis differ in retinas of albino and pigmented mice, both absolutely, with the temporal aspect of the retina expanded in albino, and relative to the position of the optic nerve head. Finally, blocking melanin synthesis in pigmented eyecups in culture leads to an increase in RGC differentiation, consistent with a role for melanin formation in regulating RGC neuronogenesis. These results point to spatiotemporal defects in neuronal production in the albino retina, which could perturb expression of genes that specify cell fate, number, and/or projection phenotype.


Figures
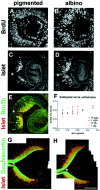
Fig. 1.
Fig. 1.
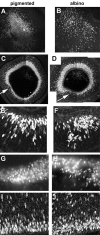
RGCs initiate proliferation and differentiation at the same time in pigmented and albino retina. Images are 1 μm confocal sections taken in the frontal plane from E11–E13 mouse retinas. Dorsal is up, and eyes are facing to theright. The optic nerve head is marked by anasterisk. Retinas from pigmented animals are shown inA, C, E, G; albino in B, D, H.A, B, A single injection of BrdU was given to pregnant females 5–30 min before litters were killed at E11. Cells labeled with an anti-BrdU antibody revealing that proliferation occurs robustly throughout the forming neural retina, whereas the centrally located lens has actively dividing cells only around its periphery. C, D, The initial region of postmitotic, Islet-positive ganglion cells develops centrally surrounding the future optic nerve head on late E11-early E12 in both pigmented and albino retina. E, Brn3b (green), another marker of RGCs, is expressed in the same retinal cells as Islet (red), with a similar time of onset. F, Among three E14 litters containing both pigmented and albino embryos, retinal area is correlated with embryonic weight. This graph demonstrates intralitter variation in embryonic size. G, H, Doublecortin is a microtubule-associated protein found in RGC axons. Along with Islet (red), doublecortin (green) is expressed at E13, when ganglion cells first send axons out of the retina. Scale bars: A–E, 100 μm; G, H, 200 μm.
Fig. 2.
Fig. 2.
The embryonic albino retina displays abnormal cellular organization. Sagittal (A–D) or frontal (E–J) sections of embryonic pigmented (A, C, E, G, I) and albino (B, D, F, H, J) retinas were labeled with Islet antibody and imaged with confocal (A–F, I, J) or regular light (G, H) microscopy. Images were taken from 100 μm vibratome sections unless otherwise noted. A, B,En face or ophthalmoscopic views of the embryonic retina surrounding the optic nerve head demonstrate the position of the first Islet-positive RGCs at early E12. Dorsal is upward. Note that the distribution of labeled cells in the albino is less tightly packed and scattered over a wider area than in pigmented retina. At E14 (C, D), Islet-positive cells have accumulated circumferentially around the retina. An abrupt change in the thickness of the Islet-positive layer is apparent in both pigmented and albino samples (arrows). This change is more pronounced in the albino, which displays a thicker layer dorsal and a relative paucity of cells ventral to thearrow, compared with pigmented. In the albino retina, labeled cells lack the regular radial alignment seen in the pigmented samples. E, F, E12.0 retina in frontal section, labeled with an antibody against Islet 1/2, showing severe disruption of the ganglion cell layer in albino. Cells appear smaller and nuclei less oriented in the normal radial dimension.G, H, Cryostat sections of E16 retinal periphery reveal further examples of cellular disorganization.I, J, Otx2-positive cells in E16 retina are located just above the ventricular cleft separating the neural retina and the pigment epithelium (single layer of cells at the lower border). Notice the smaller size, greater number, and nonspecific orientation of Otx2-positive cells in the albino retina.
Fig. 3.
Fig. 3.
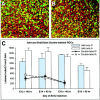
More ganglion cells are born during the first two days of neuronogenesis in albino compared with pigmented retina.A, B, Confocal images of whole-mount retinas injected with BrdU at E12 and killed at E14, from the data set quantitated below. Islet-positive cells (red) and BrdU-positive cells (green) in the albino (B) appear smaller and more numerous than in pigmented retina (A). C, Graph of Islet-positive cells (bars) and BrdU-positive cells within the Islet-positive RGC layer (lines) from litters injected with BrdU at E12, E14, E16, and E18 and killed 40 hr later, reflecting the average sum of cells in all five z planes (Islet) or the top two z planes (BrdU-Islet). The graph represents data from one mixed litter (pigmented and albino littermates) at each of the four ages and reflects the number of Islet- or BrdU/Islet-positive cells per 0.1 mm2 field, rather than the overall numbers of Islet-positive cells in the retina. In the albino retina, the density of all Islet-positive ganglion cells is increased at E14, and BrdU/Islet-positive ganglion cells (the subset of those Islet-positive RGCs labeled between E12 and E14) also show a trend toward increased density. At E18, the Islet counts probably include some amacrine cells, which begin to express Islet at this age, while RGCs continue to express it (Galli-Resta et al., 1997). Few BrdU-positive cells are found in the ganglion cell layer after injection at E18, so data for this time point were not included.
Fig. 4.
Fig. 4.
A larger fraction of ipsilateral RGCs in ventrotemporal retina is produced during the initial period of neuronogenesis in albino retina. A–D, Confocal images of whole-mount retina showing dextran retrograde-labeled ipsilateral RGCs (red) and BrdU-positive cells (green). These retinas were exposed to BrdU on E14 (A, B) or E15 (C, D) and injected with dextran into the ipsilateral optic tract on E17–E18. The fraction of all dextran-positive cells that are also BrdU-positive is shown in the bottom right corner of each panel. E,Quantitation of a larger data set, including the images shown inA–D. BrdU was injected on the day specified, and dextran labeling was performed on E17–E18. The graph shows the fraction of double-labeled RGCs after BrdU injection on the day indicated. Note that significantly more ipsilateral-projecting RGCs were labeled with BrdU on E11 and E14. Data from 52 pigmented and 30 albino animals are shown, and an average of 893 ± 80 (SEM) dextran-positive, ipsilateral-projecting cells were analyzed per retina.
Fig. 5.
Fig. 5.
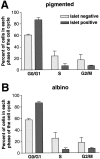
Flow cytometry shows no difference in cell cycle parameters in embryonic albino retina. Embryonic retinas were dissected at E13 and labeled with propidium iodide +/− Islet. DNA is labeled by propidium iodide in a quantitative manner, allowing cells in G0/G1 (2× DNA) to be separated from those in G2/M phases (4× DNA). For cycling cells, the percentage of cells in each phase of the cell cycle is proportional to the relative length of that phase. At E13, the neuroblastic fraction of cells (Islet-negative) has fewer cells in G1/G0 phase and more in S and G2/M phases than Islet-positive ganglion cells, suggesting that most Islet-positive cells have left the cell cycle. No differences were detected by flow cytometry in cell cycle parameters between pigmented (A) and albino (B) retina among either Islet-negative or Islet-positive cells. Between 10,000 and 80,000 cells were analyzed per genotype in each experiment, and each bar represents data from three experiments.
Fig. 6.
Fig. 6.
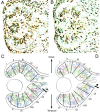
Sequential injection of two different S-phase labels allows determination of cell cycle parameters in small sectors of the retinal VZ that can be compared in different specimens based on alignment with the optic nerve head. E11 retina from pigmented (A) and albino (B) littermates which received sequential injections of 3H-dT and BrdU with a 2 hr interinjection interval and were killed 0.5 hr after the BrdU injection. Four-micrometer-thick horizontal sections were processed for immunohistochemical visualization of BrdU and for autoradiographic visualization of 3H-dT and were counterstained with thionin. The position and labeling category of all nuclei in all sections examined were recorded on corresponding camera lucida drawings made with a 40× objective at a final magnification of 550× (C,D:blue = 3H-dT only; red = BrdU only;green = double-labeled; black = unlabeled). The ventricular surface was measured nasally and temporally from the center of the optic stalk and parcelated into 50 μm sectors beginning from where the ventricular zone was at its full width (star) or at least 50 μm from the center of the optic stalk. Sector divisions were drawn parallel to the radial alignment of the nuclei, and sectors were numbered sequentially from peripheral nasal to peripheral temporal (I–XI). Counts of each type of nucleus were made and analyzed separately for each sector; nuclei touching the borders were included in the more central sector counts. Only complete 50 μm sectors were counted.
Fig. 7.
Fig. 7.
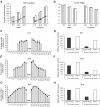
Quantitative analyses of cell numbers and distributions and Ts/Tc ratios in nasal and temporal retina at three embryonic ages. A, Average numbers of cells per 4-μm-thick section in nasal and temporal hemiretinas at E11, E12, and E13. Bars represent total number of cells in pigmented (shaded bar) and albino (white bar) retinas.Lines represent number of unlabeled cells in pigmented (closed circles) and albino (open circles). Differences between pigmented and albino are insignificant in nasal hemiretina. In temporal retina, the total number of cells in albino is significantly higher than in pigmented at E11 and E12, and that difference is primarily accounted for by a greater number of unlabeled cells. At E13 there is no significant difference between the genotypes. B, The Ts:Tc ratio decreases with developmental age in both pigmented and albinos. At E11 the Ts:Tca ratio is significantly lower in albino temporal hemiretina. There is no difference between the genotypes in the temporal retina at E12 or E13 or in nasal hemiretina at any age examined. C, E, G, Average total number of cells per 50 μm sector in albino (bars) and pigmented (circles) retinas at E11, E12, and E13. The graphs for all ages have been aligned in register with the optic nerve head and the sector numbers from E13 (from peripheral nasal I to peripheral temporal XXII) used throughout. The most striking difference is the additional sector at the temporal periphery of albino at E11 and E12. D, F,H, Percentage of pigmented (black bars) and albino (white bars) retinas which contain one or two additional sectors in the most peripheral part of the temporal retina at E11, E12, and E13. Counts were recorded only in those sectors present in each section; i.e., in computing average numbers per sector, the denominator was the number of sections in which each sector was present. Thus, although the average number of cells present in sector XXII at E13 was similar in the two genotypes when sector XXII was present (G), only 29% of pigmented retinas had this sector, whereas 83% of albino retinas did (H). This suggests that the peripheral growth of the retina is qualitatively similar in the two genotypes but takes place on a different time scale. ONH, Nerve head. Number of specimens included (n) for pigmented/albino: E11, 8/9; E12, 11/10;E13, 7/7.
Fig. 8.
Fig. 8.
The Tca gradient across the retinal sheet is similar in contour but different in alignment with the optic nerve head in albino and pigmented genotypes at E11 and E12. The apparent Tc (Tca) in each 50 μm sector from peripheral nasal through the optic nerve head to peripheral temporal in albino (open circles) and pigmented (closed circles) retinas at E11 and E12. A lengthening of Tca to either side of the ONH is seen in both genotypes at E12 but in albino only at E11. A,B, When the curves are in register with the ONH, the “additional” segment in the temporal periphery of the albino retina is apparent. C, D, When registered with their peaks, the shapes of the curves of the two genotypes are remarkably similar, suggesting that in the two genotypes the Tc gradient across the retinal sheet is similar in magnitude and nasal-temporal extent but different with respect to the position of the ONH. In the pigmented retina, the Tc gradient appears to be approximately symmetrical around the ONH, whereas in albino the peak of the gradient is within the temporal retina. However, in both cases, the position of the peak from the temporal edge of the retina is similar. ONH, Nerve head. Number of specimens included (n) for pigmented/albino: E11,8/9; E12, 11/10; E13, 7/7.
Fig. 9.
Fig. 9.
The events that distinguish the retinal proliferative population of albino and pigmented genotypes occur between E11 and E13 and involve both a lengthening of Tc and increased output from the proliferative population. A–C, Average number of unlabeled cells (G0/G1) per section in each 50 μm sector in albino (white bars) and pigmented (circles) retinas at E11, E12, and E13. The graphs for all ages have been aligned in register with the ONH and the sector numbers from E13 (from peripheral nasal I to peripheral temporal XXII) used throughout. The greater number of unlabeled nuclei temporal to the ONH in albino at E11 (B) and E12 (C) is consistent with the temporal “shift” if the Tca gradient seen in albino (Fig.10C,D). Counts were recorded only in those sectors present in each section; i.e., in computing average numbers per sector, the denominator was the number of sections in which each sector was present. D–F, Percentage of unlabeled cells in each sector of the VZ in albino (white bars) and pigmented (black bars) retinas at E11, E12, and E13. Thecircles indicate the differences (deltas) between albino and pigmented values. At Ell (D), the deltas are quantitatively different in nasal versus temporal retina, whereas at E12 and E13 (E, F) the delta values are similar in nasal and temporal retina (disregarding the “extra” segments).ONH, Nerve head. Number of specimens included (n) for pigmented/albino: E11,8/9; E12, 11/10; E13, 7/7.
Fig. 10.
Fig. 10.
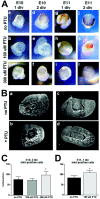
PTU inhibits pigment formation in eyecupsin vitro, and the number of Islet-positive cells increases when pigment production is blocked. A, Eyecups were grown for 1–2 d in vitro (div) in SFM in the absence or presence of PTU (100 or 300 μm). PTU completely prevents pigment formation in E10 eyecups at all concentrations (A, a–f). The faint dark coloration in some of these eyecups is from red blood cells. At E11, retinal pigment is already present. Blocking tyrosinase activity results in a reduction of pigmentation over time, but does not completely abolish melanin even after 2 d in culture at the highest dose (A, g–l). B, Eyecups cultured according to the conditions in A were sectioned at 8 μm and labeled with an antibody to Islet. Both E10, 2 div (B, a,b) and E11, 1 div (B, c,d) eyecups show more Islet-positive cells when treated with PTU. Morphology of the eyecups after 1–2 d in culture is intact, with clear visibility of the lens, neural retina, and RPE. PTU-treated eyecups show a higher number of Islet-positive cells. C, D,Quantitation of the experiments shown above. E10, 2 div eyecups show an increase in Islet-positive cells when grown in the presence of 200 μm (but not 100 μm) PTU (C). At E10 the concentration of PTU required to cause an increase in the number of Islet-positive cells (200 μm) is greater than the concentration required to block melanin synthesis (≤100 μm; Ab above), suggesting a dichotomy in the regulation of the two processes. E11, 1 div eyecups treated with 100 μm PTU display an increase in Islet-positive cells (D). At E11, the increase in Islet expression occurs in the presence of some retinal melanin (see Ahabove), suggesting an effect of blocking tyrosinase activity separate from the presence of melanin itself. Results represent cell counts from 21–62 sections taken from 4–13 eyecups at each data point.

Similar articles

Cited by

References

    1. Alexiades M, Cepko C. Quantitative analysis of proliferation and cell cycle length during development of the rat retina. Dev Dyn. 1996;205:293–307. - PubMed
    1. Beisker W, Dolbeare F, Gray J. An improved immunocytochemical procedure for high-sensitivity detection of incorporated bromodeoxyuridine. Cytometry. 1987;8:235–239. - PubMed
    1. Bovolenta P, Mallamaci A, Briata P, Corte G, Boncinelli E. Implication of OTX2 in pigment epithelium determination and neural retina differentiation. J Neurosci. 1997;17:4243–4252. - PMC - PubMed
    1. Brown A, Yates P, Burrola P, Ortuño D, Vaidya A, Jessell T, Pfaff S, O'Leary D, Lemke G. Topographic mapping from the retina to the midbrain is controlled by relative but not absolute levels of EphA receptor signaling. Cell. 2000;102:77–88. - PubMed
    1. Carter-Dawson L, LaVail M. Rods and cones in the mouse retina. II. Autoradiographic analysis of cell generation using tritiated thymidine. J Comp Neurol. 1979;188:263–272. - PubMed

Publication types

MeSH terms

LinkOut - more resources