. 2002 Jun 1;22(11):4293-301.
doi: 10.1523/JNEUROSCI.22-11-04293.2002.

Transport of Neuronal BC1 RNA in Mauthner Axons

Affiliations

Transport of Neuronal BC1 RNA in Mauthner Axons

Ilham A Muslimov et al. J Neurosci. .

Abstract

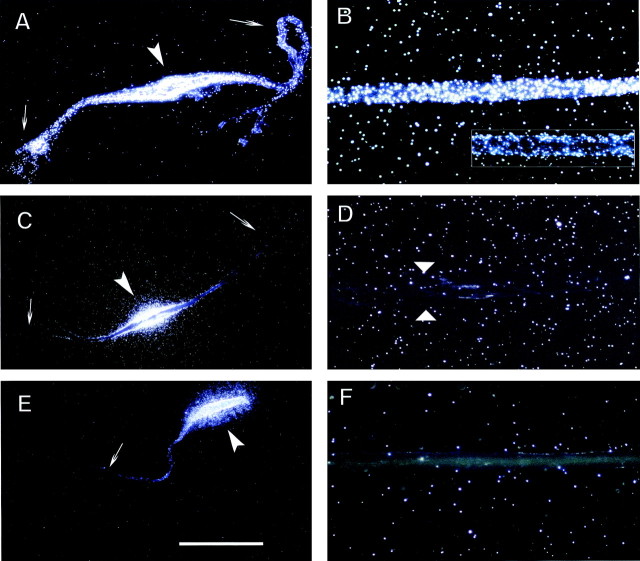
In neurons, localized RNAs have been identified in dendrites and axons; however, RNA transport in axons remains poorly understood. Here we analyzed axonal RNA transport in goldfish Mauthner neurons in vivo. BC1 RNA, a noncoding RNA polymerase III transcript that is targeted to dendrites in neurons of the rodent nervous system, was used as a probe for axonal RNA transport. Somata of Mauthner neurons were microinjected with various RNAs. Full-length BC1 RNA, but not control RNAs of similar length, was targeted to both axons and dendrites of Mauthner neurons. BC1 RNA was transported in the form of a rapidly advancing wave front that progressed along axons, in a microtubule-dependent manner, at a rate of 2 micrometer/sec. Whereas a BC1 5' segment of 65 nucleotides was transported to axons and dendrites in a way indistinguishable from full-length BC1 RNA, a BC1 3' segment of 60 nucleotides did not enter Mauthner cell processes to any significant extent. In the wake of the wave advancing through the axon, BC1 RNA was found localized to discrete, spatially delimited domains at the axonal surface. Such demarcated cortical concentrations of BC1 RNA could not be observed after disruption of F-actin organization in the axon. It is concluded that the specific delivery of BC1 RNA to spatially defined axonal target sites is a two-step process that requires the sequential participation of microtubules for long-range axial transport and of actin filaments for local radial transfer and focal accumulation in cortical domains.


Figures

Fig. 1.
Fig. 1.
Transport and localization of microinjected BC1 RNA in Mauthner neurons. AD, Full-length radiolabeled BC1 RNA was injected into the perikarya of Mauthner cells in vivo (total number of cells injected: 55). A, Two hours after injection, labeling signal was substantial over cell body (arrowhead) and dendrites, including distal dendritic regions (arrows).B, Significant labeling for BC1 RNA was apparent in the axoplasmic whole mount of the same cell. Photomicrograph was taken at a distance of 10 mm from soma. (The distance at this time point corresponds to the rear slope of the advancing wave, as shown in Fig.3B.) The appearance of the labeling signal at this position was patchy to uniform. C, D, Focal accumulations of BC1 labeling signal (arrowheads) were revealed in the wake of the advancing front in axons. For these experiments, injection amounts were lowered below the typical amounts by a factor of 5 to ensure that labeling in the trailing part of the advancing wave would not obscure BC1 foci.EH, Mauthner neurons were injected with an irrelevant-sequence RNA of 144 nt (E,F; number of cells injected: 4) or with nuclear U4 RNA (G, H; number of cells injected: 8). Post-injection intervals were 2 hr. Although injected somata were strongly labeled (E, G,arrowheads), no significant labeling was detected either in dendrites (E, G,arrows), except for a proximal-most region, or in axoplasmic whole mounts (F, H; distance from soma: 10 mm). Arrowheads in Findicate axonal boundaries. Please note that although Mauthner neurons typically have two dendrites, one may be lost during dissection. Scale bar (shown in G): A, E,G, 100 μm; BD,F, H, 50 μm.
Fig. 2.
Fig. 2.
Transport competence of the BC1 5′ domain in Mauthner neurons. Mauthner cell perikarya were injected in vivo with a BC1 5′ segment (A, B; number of cells injected: 46), a BC1 3′ segment (C,D; number of cells injected: 27), or a 64 nt irrelevant-sequence RNA (E, F; number of cells injected: 5). Post-injection intervals were 2 hr.A, C, E, Somata/dendrites (arrows indicate dendrites; arrowheadsindicate somata); B, D, F, axoplasmic whole mounts (photographed at 10 mm distance from somata). Microinjection of the BC1 5′ segment resulted in labeling of somata and dendrites (A) as well as along axoplasmic whole mounts (B). Superficial accumulations of silver grains in cortical axonal domains were revealed after injection of low amounts of the BC1 5′ segment (B, inset). After injection of a BC1 3′ segment (C,D), no significant labeling was observed along either dendrites (C) or axons (D;arrowheads indicate axonal boundaries). Likewise, injection of a 64 nt irrelevant-sequence RNA did not produce any significant dendritic (E) or axonal labeling (F). Scale bar (shown in E):A, C, E, 100 μm;B, D, F, 50 μm.
Fig. 3.
Fig. 3.
Time-dependent proximo-distal translocation of BC1 RNA along Mauthner cell axons. A, Labeling profiles as determined 1 hr after injection into Mauthner somata.Light gray bars indicate full-length BC1 RNA; 24 axons were analyzed. Dark gray bars indicate BC1 5′ segment; 15 axons were analyzed. An additional evaluation point (data not shown) was at 0.5 mm, with signal intensities not significantly different from the subsequent three evaluation points. Signal intensities (relative units) were determined at each evaluation point as described in Materials and Methods. From the combined data for full-length BC1 RNA, we calculated the average position of the labeling peak maximum after 1 hr as 7900 ± 789 μm (mean ± SEM). The corresponding average transport velocity was 2.2 ± 0.2 μm/sec. For the BC1 5′ segment, the respective numbers were 7817 ± 689 μm, again yielding an average transport velocity of 2.2 ± 0.2 μm/sec. B, Profiles of axonal labeling signals at four additional time points after somatic injection of full-length BC1 RNA. Signal intensities were defined and calculated as inA. C, Synoptic compilation of axonal labeling profiles generated by somatic injection of full-length BC1 RNA. The number of axons analyzed per time point are as follows: 0.5 hr, 2; 1 hr, 24; 1.5 hr, 10; 2 hr, 28; 2.5 hr, 18; 3 hr, 16; 4 hr, 6. Error bars have been omitted for clarity. Transport rates were calculated for four time points and are given in the format mean ± SEM in the inset.
Fig. 4.
Fig. 4.
Cytoskeletal systems implicated in the transport and localization of BC1 RNA in Mauthner axons. Radiolabeled BC1 RNA was microinjected into the Mauthner cell body, followed by microinjection of a cytoskeletal disrupting agent at a distance of 4 mm from the soma (time differential: 20 ± 5 min). The tissue was fixed 1 hr after injection of BC1 RNA, a time when the peak of the wave front was normally located at 8 mm distal to the soma. Axons and perikaryra were then isolated and processed as described in Materials and Methods. AC, Vinblastine (1 μm), which disrupts microtubules, was injected into the axon (7 axons analyzed). A robust labeling signal was observed in dendrites (A) and in the axonal segment proximal to the vinblastine injection site (B; showing an area at a distance of 3.5 mm from the soma). No significant labeling was observed distal to the vinblastine injection site (C; showing an area at a distance of 8 mm from the soma).DF, Cytochalasin D (10 μm), a specific F-actin depolymerizing agent, was injected intra-axonally (7 axons analyzed). Dendrites were again labeled (D). In the axon, BC1 labeling appeared in form of a peak at 8 mm (F) where it was restricted to the axoplasmic core (F,arrows). At times, labeling in this peak area was “trail-like” in appearance (F,inset). No significant labeling was observed in axonal areas proximal to the peak (E; distance from soma is 1 mm). Arrows in A and Dindicate labeled dendrites. Arrowheads indicate axonal circumferences. Scale bar (shown in A):A, D, 100 μm; B,C, E, F, 50 μm.G, Schematic diagram depicts the approximate location of the Mauthner cells (M-cell) in the rostral medulla and the distribution of their axons (M-axon) in the spinal cord. The corresponding diagram (H) shows the injection sites of vinblastine (vinbl) and cytochalasin D (cyt D), as well as the relative locations of regions illustrated in photomicrographsAF.
Fig. 5.
Fig. 5.
Inhibition by vinblastine of anterograde BC1 translocation in Mauthner axons. Cells were fixed 1 hr after injection of BC1 RNA. A, B, Intrasomatic injection of BC1 RNA was followed after 20 min (±5 min) by intra-axonal injection of vinblastine at a distance of 4 mm from the soma (arrowheads). Two examples (of 7 experiments) are shown. Results were not averaged in these experiments because time intervals between intrasomatic and intra-axonal injections could not be controlled precisely and were therefore variable.C, Intrasomatic injection of BC1 RNA was followed after 20 min (±5 min) by intra-axonal injection of cytochalasin D at a distance of 4 mm from the soma (arrowheads). In three of seven cases, a low but significant signal was observed in the extreme proximal axonal area, directly adjacent to the soma. D, Intra-axonal injection of BC1 RNA (4 mm distal from cell body;arrowhead) produced a wave-like labeling pattern with a peak at 11 mm, indicating an anterograde translocation of the RNA at a velocity comparable to the rates observed in Figure 3.

Similar articles

Cited by

References

    1. Alvarez J, Giuditta A, Koenig E. Protein synthesis in axons and terminals: significance for maintenance, plasticity and regulation of phenotype. With a critique of slow transport theory. Prog Neurobiol. 2000;62:1–62. - PubMed
    1. Baas PW, Ahmad FJ. The transport properties of axonal microtubules establish their polarity orientation. J Cell Biol. 1993;120:1427–1437. - PMC - PubMed
    1. Banker K, Goslin K. Culturing nerve Cells. MIT; Cambridge, MA: 1998.
    1. Barker LF. The nervous system and its constituent neurons. D. Appleton and Company; New York: 1899.
    1. Bassell GJ, Zhang H, Byrd AL, Femino AM, Singer RH, Taneja KL, Lifshitz LM, Herman IM, Kosik KS. Sorting of β-actin mRNA and protein to neurites and growth cones in culture. J Neurosci. 1998;18:251–265. - PMC - PubMed

Publication types

LinkOut - more resources