Bidirectional alterations in cerebellar synaptic transmission of tottering and rolling Ca2+ channel mutant mice
- PMID: 12040045
- PMCID: PMC6758816
- DOI: 10.1523/JNEUROSCI.22-11-04388.2002
Bidirectional alterations in cerebellar synaptic transmission of tottering and rolling Ca2+ channel mutant mice
Abstract
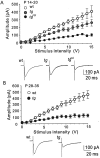
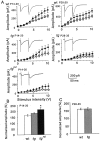
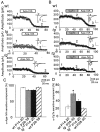
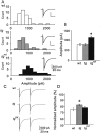
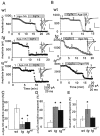
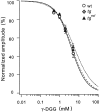
Hereditary ataxic mice, tottering (tg) and rolling Nagoya (tg(rol)), carry mutations in the P/Q-type Ca(2+) channel alpha(1A) subunit gene. The positions of the mutations and the neurological phenotypes are known, but the mechanisms of how the mutations cause the symptoms and how the different mutations lead to various onset and severity have remained unsolved. Here we compared fundamental properties of excitatory synaptic transmission in the cerebellum and roles of Ca(2+) channel subtypes therein among wild-type control, tg, and tg(rol) mice. The amplitude of EPSC of the parallel fiber-Purkinje cell (PF-PC) synapses was considerably reduced in ataxic tg(rol). Although the amplitude of the parallel fiber-mediated EPSC was only mildly decreased in young non-ataxic tg mice, it was drastically diminished in adult ataxic tg mice of postnatal day 28-35, showing a good correlation between the impairment of the PF-PC synaptic transmission and manifestation of ataxia. In contrast, the EPSC amplitude of the climbing fiber-Purkinje cell (CF-PC) synapses was preserved in tg, and it was even increased in tg(rol), which was associated with altered properties of the postsynaptic glutamate receptors. The climbing fiber-mediated EPSC was more dependent on other Ca(2+) channel subtypes in mutant mice, suggesting that such compensatory mechanisms contribute to maintaining the CF-PC synaptic transmission virtually intact. The results indicate that different mutations of the P/Q-type Ca(2+) channel not only cause the primary effect of different severity but also lead to diverse additional secondary effects, resulting in disruption of well balanced neural networks.
Figures


Similar articles
-
Impact of the leaner P/Q-type Ca2+ channel mutation on excitatory synaptic transmission in cerebellar Purkinje cells.J Physiol. 2008 Sep 15;586(18):4501-15. doi: 10.1113/jphysiol.2008.156232. Epub 2008 Jul 31. J Physiol. 2008. PMID: 18669535 Free PMC article.
-
Deletion of Cav2.1(alpha1(A)) subunit of Ca2+-channels impairs synaptic GABA and glutamate release in the mouse cerebellar cortex in cultured slices.Eur J Neurosci. 2009 Dec;30(12):2293-307. doi: 10.1111/j.1460-9568.2009.07023.x. Epub 2009 Dec 10. Eur J Neurosci. 2009. PMID: 20092572
-
Postnatal loss of P/Q-type channels confined to rhombic-lip-derived neurons alters synaptic transmission at the parallel fiber to purkinje cell synapse and replicates genomic Cacna1a mutation phenotype of ataxia and seizures in mice.J Neurosci. 2013 Mar 20;33(12):5162-74. doi: 10.1523/JNEUROSCI.5442-12.2013. J Neurosci. 2013. PMID: 23516282 Free PMC article.
-
The ataxic Cacna1a-mutant mouse rolling nagoya: an overview of neuromorphological and electrophysiological findings.Cerebellum. 2009 Sep;8(3):222-30. doi: 10.1007/s12311-009-0117-5. Epub 2009 May 30. Cerebellum. 2009. PMID: 19484318 Free PMC article. Review.
-
Zebrin II expressing Purkinje cell phenotype-related and -unrelated cerebellar abnormalities in Cav2.1 mutant, rolling mouse Nagoya.ScientificWorldJournal. 2010 Oct 12;10:2032-8. doi: 10.1100/tsw.2010.205. ScientificWorldJournal. 2010. PMID: 20953553 Free PMC article. Review.
Cited by
-
Abnormal excitability and episodic low-frequency oscillations in the cerebral cortex of the tottering mouse.J Neurosci. 2015 Apr 8;35(14):5664-79. doi: 10.1523/JNEUROSCI.3107-14.2015. J Neurosci. 2015. PMID: 25855180 Free PMC article.
-
Impact of the leaner P/Q-type Ca2+ channel mutation on excitatory synaptic transmission in cerebellar Purkinje cells.J Physiol. 2008 Sep 15;586(18):4501-15. doi: 10.1113/jphysiol.2008.156232. Epub 2008 Jul 31. J Physiol. 2008. PMID: 18669535 Free PMC article.
-
Flocculus Purkinje cell signals in mouse Cacna1a calcium channel mutants of escalating severity: an investigation of the role of firing irregularity in ataxia.J Neurophysiol. 2014 Nov 15;112(10):2647-63. doi: 10.1152/jn.00129.2014. Epub 2014 Aug 20. J Neurophysiol. 2014. PMID: 25143538 Free PMC article.
-
Calcium channels and synaptic transmission in familial hemiplegic migraine type 1 animal models.Biophys Rev. 2014 Mar;6(1):15-26. doi: 10.1007/s12551-013-0126-y. Epub 2013 Dec 3. Biophys Rev. 2014. PMID: 28509957 Free PMC article. Review.
-
STD-dependent and independent encoding of input irregularity as spike rate in a computational model of a cerebellar nucleus neuron.Cerebellum. 2011 Dec;10(4):667-82. doi: 10.1007/s12311-011-0295-9. Cerebellum. 2011. PMID: 21761198 Free PMC article.
References
-
- Aiba A, Kano M, Chen C, Stanton ME, Fox GD, Herrup K, Zwingman TA, Tonegawa S. Deficient cerebellar long-term depression and impaired motor learning in mGluR1 mutant mice. Cell. 1994;79:377–388. - PubMed
-
- Altman J, Bayer SA. Development of the cerebellar system. CRC; Boca Raton, FL: 1997.
-
- Artalejo CR, Adams ME, Fox AP. Three types of Ca2+ channel trigger secretion with different efficacies in chromaffin cells. Nature. 1994;367:72–76. - PubMed
-
- Bourinet E, Soong TW, Sutton K, Slaymaker S, Mathews E, Monteil A, Zamponi GW, Nargeot J, Snutch TP. Splicing of α1A subunit gene generates phenotypic variants of P- and Q-type calcium channels. Nat Neurosci. 1999;2:407–415. - PubMed
Publication types
MeSH terms
Substances
LinkOut - more resources
Full Text Sources
Other Literature Sources
Molecular Biology Databases
Miscellaneous
