Multiple mechanisms for the potentiation of AMPA receptor-mediated transmission by alpha-Ca2+/calmodulin-dependent protein kinase II
- PMID: 12040047
- PMCID: PMC6758819
- DOI: 10.1523/JNEUROSCI.22-11-04406.2002
Multiple mechanisms for the potentiation of AMPA receptor-mediated transmission by alpha-Ca2+/calmodulin-dependent protein kinase II
Abstract
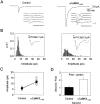
Some forms of activity-dependent synaptic potentiation require the activation of postsynaptic Ca(2+)/calmodulin-dependent protein kinase II (CaMKII). Activation of CaMKII has been shown to phosphorylate the glutamate receptor 1 subunit of the AMPA receptor (AMPAR), thereby affecting some of the properties of the receptor. Here, a recombinant, constitutively active form of alphaCaMKII tagged with the fluorescent marker green fluorescent protein (GFP) [alphaCaMKII(1-290)-enhanced GFP (EGFP)] was expressed in CA1 pyramidal neurons from hippocampal slices. The changes in glutamatergic transmission onto these cells were analyzed. AMPA but not NMDA receptor-mediated EPSCs were specifically potentiated in infected compared with nearby noninfected neurons. This potentiation was associated with a reduction in the proportion of synapses devoid of AMPARs. In addition, expression of alphaCaMKII(1-290)-EGFP increased the quantal size of AMPAR-mediated responses. This effect reflected, at least in part, an increased unitary conductance of the channels underlying the EPSCs. These results reveal that several key features of long-term potentiation of hippocampal glutamatergic synapses are reproduced by the sole activity of alphaCaMKII.
Figures


Similar articles
-
Input- and subunit-specific AMPA receptor trafficking underlying long-term potentiation at hippocampal CA3 synapses.Eur J Neurosci. 2004 Jul;20(1):101-10. doi: 10.1111/j.1460-9568.2004.03461.x. Eur J Neurosci. 2004. PMID: 15245483
-
Postsynaptic expression of a new calcium pathway in hippocampal CA3 neurons and its influence on mossy fiber long-term potentiation.J Neurosci. 2002 Jun 1;22(11):4312-20. doi: 10.1523/JNEUROSCI.22-11-04312.2002. J Neurosci. 2002. PMID: 12040036 Free PMC article.
-
Postsynaptic density 95 controls AMPA receptor incorporation during long-term potentiation and experience-driven synaptic plasticity.J Neurosci. 2004 Jan 28;24(4):916-27. doi: 10.1523/JNEUROSCI.4733-03.2004. J Neurosci. 2004. PMID: 14749436 Free PMC article.
-
Synaptic plasticity: a molecular memory switch.Curr Biol. 2001 Oct 2;11(19):R788-91. doi: 10.1016/s0960-9822(01)00472-9. Curr Biol. 2001. PMID: 11591339 Review.
-
Activity-driven postsynaptic translocation of CaMKII.Trends Pharmacol Sci. 2005 Dec;26(12):645-53. doi: 10.1016/j.tips.2005.10.003. Epub 2005 Oct 25. Trends Pharmacol Sci. 2005. PMID: 16253351 Review.
Cited by
-
Herbal formula GAPT prevents beta amyloid deposition induced Ca(2+)/Calmodulin-dependent protein kinase II and Ca(2+)/Calmodulin-dependent protein phosphatase 2B imbalance in APPV717I mice.BMC Complement Altern Med. 2016 Jun 1;16:159. doi: 10.1186/s12906-016-1144-7. BMC Complement Altern Med. 2016. Retraction in: BMC Complement Med Ther. 2021 May 28;21(1):157. doi: 10.1186/s12906-021-03331-0. PMID: 27245225 Free PMC article. Retracted.
-
CREB-dependent transcriptional control and quantal changes in persistent long-term potentiation in hippocampal interneurons.J Neurosci. 2012 May 2;32(18):6335-50. doi: 10.1523/JNEUROSCI.5463-11.2012. J Neurosci. 2012. PMID: 22553039 Free PMC article.
-
Emotional learning and glutamate: translational perspectives.CNS Spectr. 2005 Oct;10(10):831-9. doi: 10.1017/s1092852900010439. CNS Spectr. 2005. PMID: 16400246 Free PMC article. Review.
-
Synaptic memory requires CaMKII.Elife. 2021 Dec 15;10:e60360. doi: 10.7554/eLife.60360. Elife. 2021. PMID: 34908526 Free PMC article.
-
CaMKII autophosphorylation is the only enzymatic event required for synaptic memory.Proc Natl Acad Sci U S A. 2024 Jun 25;121(26):e2402783121. doi: 10.1073/pnas.2402783121. Epub 2024 Jun 18. Proc Natl Acad Sci U S A. 2024. PMID: 38889145 Free PMC article.
References
-
- Barria A, Muller D, Derkach V, Griffith LC, Soderling TR. Regulatory phosphorylation of AMPA-type glutamate receptors by CaM-KII during long-term potentiation. Science. 1997a;276:2042–2045. - PubMed
-
- Barria A, Derkach V, Soderling T. Identification of the Ca2+/calmodulin-dependent protein kinase II regulatory phosphorylation site in the α-amino-3-hydroxyl-5-methyl-4-isoxazole-propionate-type glutamate receptor. J Biol Chem. 1997b;272:32727–32730. - PubMed
-
- Behrends JC, ten Bruggencate G. Changes in quantal size distributions upon experimental variations in the probability of release at striatal inhibitory synapses. J Neurophysiol. 1998;79:2999–3011. - PubMed
-
- Benke TA, Luthi A, Isaac JT, Collingridge GL. Modulation of AMPA receptor unitary conductance by synaptic activity. Nature. 1998;393:793–797. - PubMed
Publication types
MeSH terms
Substances
LinkOut - more resources
Full Text Sources
Miscellaneous
