. 2002 Jun 1;22(11):4437-47.
doi: 10.1523/JNEUROSCI.22-11-04437.2002.

Regional calcium regulation within cultured Drosophila neurons: effects of altered cAMP metabolism by the learning mutations dunce and rutabaga

Affiliations

Regional calcium regulation within cultured Drosophila neurons: effects of altered cAMP metabolism by the learning mutations dunce and rutabaga

Brett Berke et al. J Neurosci. .

Abstract

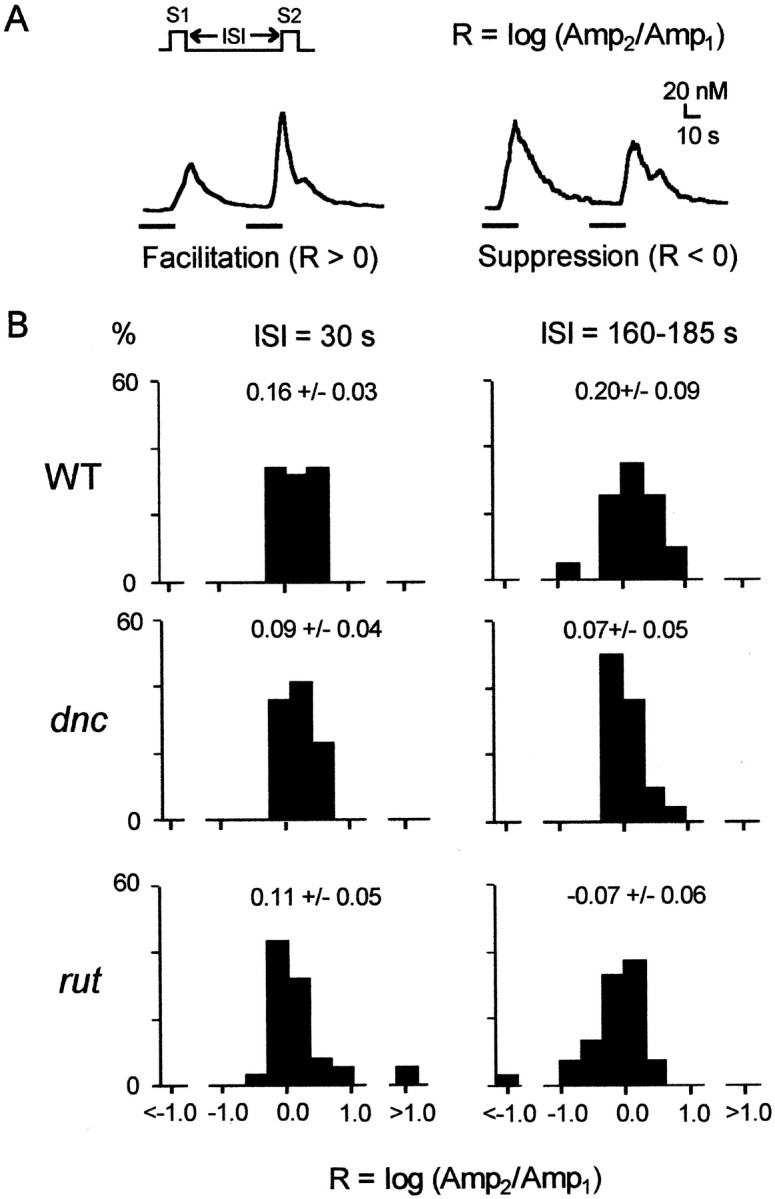
The dunce (dnc) and rutabaga (rut) mutations of Drosophila affect a cAMP-dependent phosphodiesterase and a Ca(2+)/CaM-regulated adenylyl cyclase, respectively. These mutations cause deficiencies in several learning paradigms and alter synaptic transmission, growth cone motility, and action potential generation. The cellular phenotypes either are Ca(2+) dependent (neurotransmission and motility) or mediate a Ca(2+) rise (action potential generation). However, interrelations among these defects have not been addressed. We have established conditions for fura-2 imaging of Ca(2+) dynamics in the "giant" neuron culture system of Drosophila. Using high K(+) depolarization of isolated neurons, we observed a larger, faster, and more dynamic response from the growth cone than the cell body. This Ca(2+) increase depended on an influx through Ca(2+) channels and was suppressed by the Na(+) channel blocker TTX. Altered cAMP metabolism by the dnc and rut mutations reduced response amplitude in the growth cone while prolonging the response within the soma. The enhanced spatial resolution of these larger cells allowed us to analyze Ca(2+) regulation within distinct domains of mutant growth cones. Modulation by a previous conditioning stimulus was altered in terms of response amplitude and waveform complexity. Furthermore, rut disrupted the distinction in Ca(2+) responses observed between the periphery and central domain of growth cones with motile filopodia.


Figures

Fig. 1.
Fig. 1.
The high K+depolarization-induced Ca2+ increase is distinct between the soma and growth cone. A, Phase-contrast and pseudocolor images of a wild-type cell are shown during and after perfusion of 60 mm K+ (60 K) from 0 to 30 sec. Depolarization caused a Ca2+ increase within discrete locations along the proximal neurite and at the growth cone, later appearing in the cell body (see color scale bar inB for Ca2+ levels). In the phase-contrast and 25 sec pseudocolor images, boxed regions indicate where fura-2 fluorescence was quantified.B, Quantification of intracellular Ca2+ over time accentuates the differences in response amplitude between the soma (S) and growth cone (GC). Accompanying the larger amplitude, the growth cone responds with faster kinetics (inset, amplitude normalization). Amplitude normalization was performed by subtracting the minimum value from every point and then dividing by the peak value. This caused the normalized value of each point of the trace to vary between 0 and 1. Scale bar (shown in A): 10 μm.Black bars in B indicate the perfusion of 60 K saline.
Fig. 2.
Fig. 2.
TTX-sensitive influx through voltage-gated Ca2+ channels. A, Depolarization in 0 Ca2+ saline (represented as a black bar within a white bar) eliminated the increase by 30 mm K+ saline (30 K). Images of peak Ca2+ are shown before, during, and after exchange of the bath saline with one lacking Ca2+.B, Application of 6 mm CoCl2during 60 K stimulation had a similar affect. C, The addition of 1 μm TTX only partially eliminated the Ca2+ increase during 30 sec of 60 K stimulation.
Fig. 3.
Fig. 3.
Action potential generation and whole-cell outward currents from fura-2-loaded giant neurons. A, Action potential generation was not impaired in fura-2-loaded neurons during whole-cell patch-clamp experiments. Representative action potential activities in response to current injection of two tonically firing neurons are shown, one loaded with fura-2 (+) and the other not (−).B, Whole-cell outward currents, composed mostly of various types of K+ currents, were measured from loaded and nonloaded cultures. Four categories (types 1–4) are shown based on the proportion between the peak and sustained components and the decay time-constants of the total outward current. The proportion of cells with a response that belonged to each category of current kinetics was unaffected by fura-2 (see Results).
Fig. 4.
Fig. 4.
Regional differences in dose dependence and response kinetics. A, Frequency distributions of response amplitudes during 30 sec depolarization with the 30 and 60 K salines. Scattered responses above 0.6 μm (600 nm) are represented by a single class. Neurons in this culture system varied in the extent of the Ca2+increase, with a subpopulation containing highly sensitive growth cones and cell bodies. In general, however, the soma required 60 K stimulation to elicit a distribution comparable to that produced by 30 K in the growth cone [growth cone (GC) at 30 K 0.31 ± 0.14 vs soma (S) at 60 K 0.31 ± 0.07; mean ± SEM in micrometers for all figures except Figures5 and 8]. B, Although the latency, rise-time, and duration vary among cells, the mean latency and rise-time are smaller in the growth cone [Latency (seconds): S23.06 ± 1.14 vs GC 13.24 ± 0.99; Student'st test; p < 0.005;Rise-Time (seconds): S 16.31 ± 0.76 vs GC 11.00 ± 0.93; p < 0.005; Duration (seconds): S 31.03 ± 2.37 vs GC 27.24 ± 2.52; p< 0.5]. Latency was measured from the beginning of the stimulus to 10% of the response amplitude, rise-time from 10 to 90% of the response, and duration from 50% of the rise to 50% of the decay. The number of zones, number of neurons, and number of cultures used for data presented in this and all figures are represented as zones, neurons, and cultures. For A and B,S 30 K: 30, 21, 13, 60 K: 101, 57, 32; GC30 K: 37, 21, 16, 60 K: 37, 26, 18.
Fig. 5.
Fig. 5.
The dnc andrut mutations lower the sensitivity to high K+ depolarization more strongly in the growth cone than soma. A, Example traces from the growth cone and soma of dnc and rut neurons during 30 sec perfusion of 60 K saline (indicated by black bars).B, Response amplitudes were suppressed amongdnc and rut growth cones with 30 K andrut growth cones with 60 K (30 K: WT, 0.31 ± 0.14, dnc, 0.02 ± 0.01,rut, 0.06 ± 0.01; 60 K:WT, 0.78 ± 0.21, dnc, 0.87 ± 0.40, rut, 0.49 ± 0.12). For the soma, suppression was indicated only in rut (WT, 0.31 ± 0.07; dnc, 0.40 ± 0.08; rut, 0.13 ± 0.05). C, Cultured neurons could be categorized by regional differences in response latency (time from beginning of stimulation to 10% of the peak amplitude), with the growth cone response latency being either earlier or later than that of the soma. Samples of normalized growth cone and soma responses from the same cell of the two categories are shown. The dnc andrut mutations reversed the relationship found in the wild type, causing a larger percentage of soma responses to rise before the growth cone (quantified for 15, 15, and 10 WT,dnc, and rut neurons). ForB, 60 K (S:WT, 101, 57, 32, dnc, 89, 56, 28,rut, 91, 46, 20; GC: WT, 37, 26, 18, dnc, 51, 26, 21, rut, 68, 26, 16); 30 K (GC: WT, 37, 21, 16, dnc, 24, 11, 8, rut, 56, 16, 7).
Fig. 6.
Fig. 6.
Kinetic alterations of the Ca2+increase by dnc and rut with no change in basal Ca2+ levels. Similar to wild type,dnc and rut showed regional differences between the soma and growth cone in the rise-time and duration (Fig. 2, see legend for definition). However, the rise of Ca2+ within the growth cone was shortened byrut [Rise-Time(s): WT, 11.00 ± 0.93, dnc, 12.58 ± 1.23,rut, 7.81 ± 0.62], whereas both mutations more strongly increased the rise-time in the soma [Rise-Time(s) and Students t test:WT, 16.31 ± 0.76, dnc, 19.53 ± 0.73; p < 0.005; rut, 22.81 ± 1.84; p < 0.005]. dnc andrut increased response duration in the soma [Duration(s): WT, 31.03 ± 2.37,dnc, 48.40 ± 3.65; p < 0.0005; rut, 47.88 ± 3.22; p< 0.0005], with little effect on the growth cone (WT, 27.24 ± 2.52; dnc, 22.85 ± 1.80;rut, 26.84 ± 2.15). In contrast to these dynamic measures, the basal Ca2+ level was not affected in the mutants (values in nm; S:WT, 22.00 ± 0.91, dnc, 23.3 ± 0.81, rut, 21.51 ± 0.82; GC:WT, 24.61 ± 0.92, dnc, 22.73 ± 1.42, rut, 25.57 ± 3.07). S:WT, 101, 57, 32, dnc, 89, 56, 28,rut, 91, 46, 20; GC: WT, 37, 26, 18, dnc, 51, 26, 21, rut, 68, 26, 16.
Fig. 7.
Fig. 7.
The Ca2+ waveform and its activity-dependent modulation in dnc andrut. A, High K+-induced Ca2+ responses were categorized into three groups: simple responses of a single peak (black) and more complex responses with a shoulder during decay (gray) or with two or more distinct peaks (white, deviation from the simple decay with >25% of the peak amplitude). Data from 30 sec, high K+stimulation indicates that the growth cone exhibits more complex waveforms than the soma of wild-type neurons. Dnc andrut appeared to suppress responses with a complex waveform, especially in the soma. B, A twin-pulse paradigm revealed the influence of previous activity on the Ca2+ increase. A pair of 30 sec stimulations (S1 and S2) were given at two interstimulus intervals (ISI) (30 and 160–185 sec), and Ca2+ dynamics were recorded in the growth cone. The Ca2+ waveform acquired a shoulder or second peak (white), did not change (gray), or lost its shoulder or second peak (black). Notably, at the 160–185 sec ISI, therut mutation blocked the modulation of response kinetics. The 30, 42, and 60 K salines were used according to the responsiveness of individual cells, and mutant growth cones were in general less responsive, so the results presented fordnc and rut contain a larger proportion of 60 K data. The kinetic categories did not correlate with amplitude (data not shown). Response categories are as follows: S:WT, 131, 70, 43, dnc, 92, 51, 29,rut, 88, 40, 22; GC: WT, 87, 38, 20,dnc, 46, 26, 15, rut, 74, 26, 16. Activity-dependent changes are as follows: 30 sec ISI:WT, 38, 20, 15, dnc, 39, 13, 12,rut, 60, 20, 15; 160–185 sec ISI: WT, 20, 12, 9, dnc, 28, 11, 9, rut, 30, 15, 14.
Fig. 8.
Fig. 8.
Activity-dependent modulation of response amplitude in the growth cone. A, Example traces from the growth cones of two cells show facilitation and suppression of the high K+response amplitude during the twin-pulse protocol. A facilitation/suppression indicator, R, was calculated from the ratio of the two amplitudes [R = log (Amp1/Amp2),R = −1 represents a 10-fold suppression in amplitude, whereas R = 1 represents a 10-fold facilitation]. B, Frequency histograms of the facilitation/suppression indicator R showing the modulation of response amplitude in the growth cone. Wild-type cells showed slight facilitation of response amplitude regardless of the long (160–185 sec) or short (30 sec) ISI. In the case ofdnc, a tendency for less facilitation was observed, whereas for rut, suppression was observed at the long ISI. Data from different stimulus durations (2, 5, 10, and 30 sec) and magnitudes (30, 42, and 60 K) were combined because the mutants required stronger stimulation and because no correlation between the stimulus and facilitation/suppression was observed. 30 sec ISI:WT, 38, 20, 15, dnc, 39, 13, 12,rut, 60, 20, 15; 160–185 sec ISI: WT, 20, 12, 9, dnc, 28, 11, 9, rut, 30, 15, 14.
Fig. 9.
Fig. 9.
The spatial distribution of Ca2+ within distinct regions of the growth cone.A, Phase images of a giant neuron and its growth cone (captured with 40 and 100× objectives, respectively) showing filopodial and lamellipodial movement (arrows). For this experiment, motility was indicated by changes in filopodial or lamellipodial shape over the course of 1 min. B, Pseudocolor images (B1) showing Ca2+ within this growth cone after a 5 sec stimulation with 60 K. Ca2+ levels in the peripheral lamellipodium (zones 1 and 2) reached a higher peak concentration than within the central domain (zone3), as quantified inB2. C, The ratio of peak Ca2+ at the leading edge to levels in the central domain of the wild type were larger in motile growth cones (●) than nonmotile growth cones (○) (e.g., the ratio of an average of 2–6 zones in the periphery to an average of 1–2 zones in the central domain). In dnc, ratios of peripheral-to-central peak Ca2+ levels in motile growth cones were well beyond those of wild-type neurons, whereas extreme ratios were seen in nonmotile rut growth cones. Upward-directed arrows indicate ratios that were outside the range of they axis. Scale bars in A are 10 μm (left) and 7 μm(right). For C, WT (cells, cultures) 16, 13; dnc, 14, 11; rut, 19, 13.

Similar articles

Cited by

References

    1. Aceves-Pina EO, Booker R, Duerr JS, Livingstone MS, Quinn WG, Smith RF, Sziber PP, Tempel BL, Tully T. Learning and memory in Drosophila, studied with mutants. Cold Spring Harb Symp Quant Biol. 1983;48:831–839. - PubMed
    1. Alshuaib W, Byerly L. Modulation of membrane currents by cAMP in cleavage-arrested Drosophila neurons. J Exp Biol. 1996;199:537–548. - PubMed
    1. Azhderian EM, Hefner D, Lin CH, Kaczmarek LK, Forscher P. Cyclic AMP modulates fast axonal transport in Aplysia bag cell neurons by increasing the probability of single organelle movement. Neuron. 1994;12:1223–1233. - PubMed
    1. Babcock D, Herrington J, Goodwin P, Park Y, Hille B. Mitochondrial participation in the intracellular Ca2+ network. J Cell Biol. 1997;136:833–844. - PMC - PubMed
    1. Bailey CH, Giustetto M, Huang YY, Hawkins RD, Kandel ER. Is heterosynaptic modulation essential for stabilizing Hebbian plasticity and memory? Nat Rev Neurosci. 2000;1:11–20. - PubMed

MeSH terms

LinkOut - more resources