. 2002 Jun 1;22(11):4639-53.
doi: 10.1523/JNEUROSCI.22-11-04639.2002.

Enhanced synchrony among primary motor cortex neurons in the 1-methyl-4-phenyl-1,2,3,6-tetrahydropyridine primate model of Parkinson's disease

Affiliations

Enhanced synchrony among primary motor cortex neurons in the 1-methyl-4-phenyl-1,2,3,6-tetrahydropyridine primate model of Parkinson's disease

Joshua A Goldberg et al. J Neurosci. .

Abstract

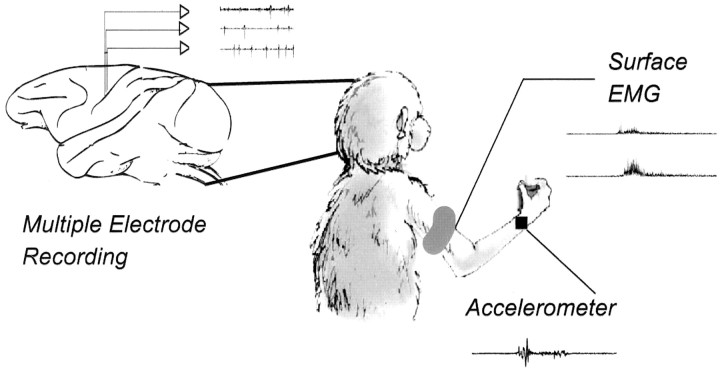
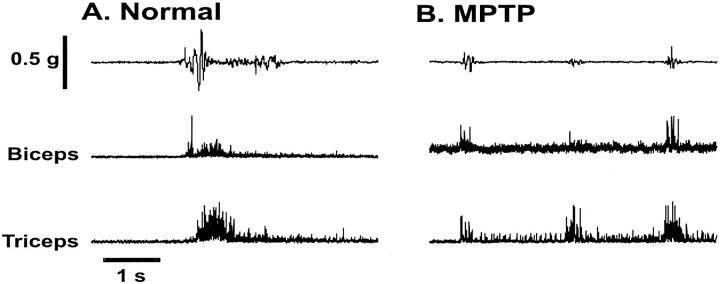
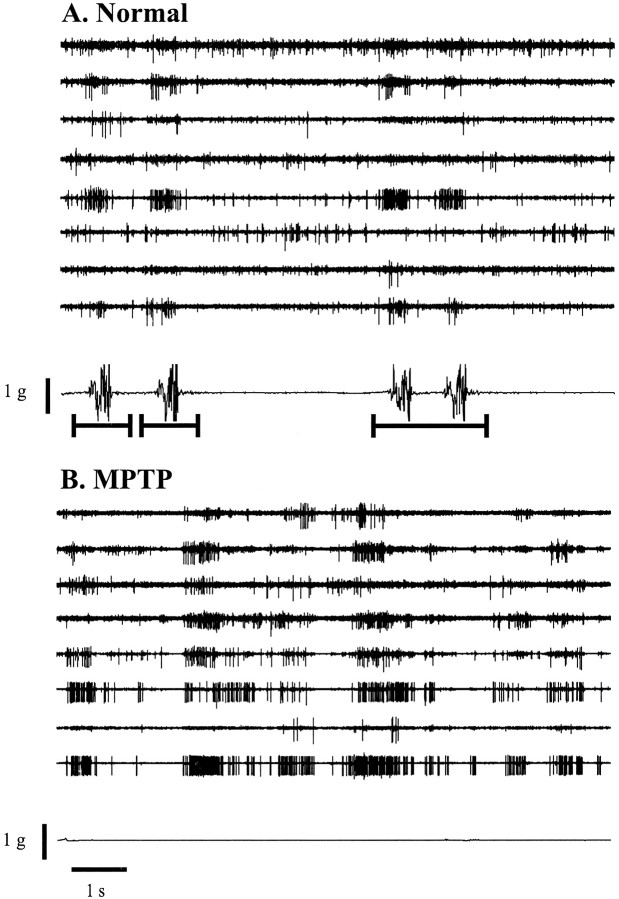
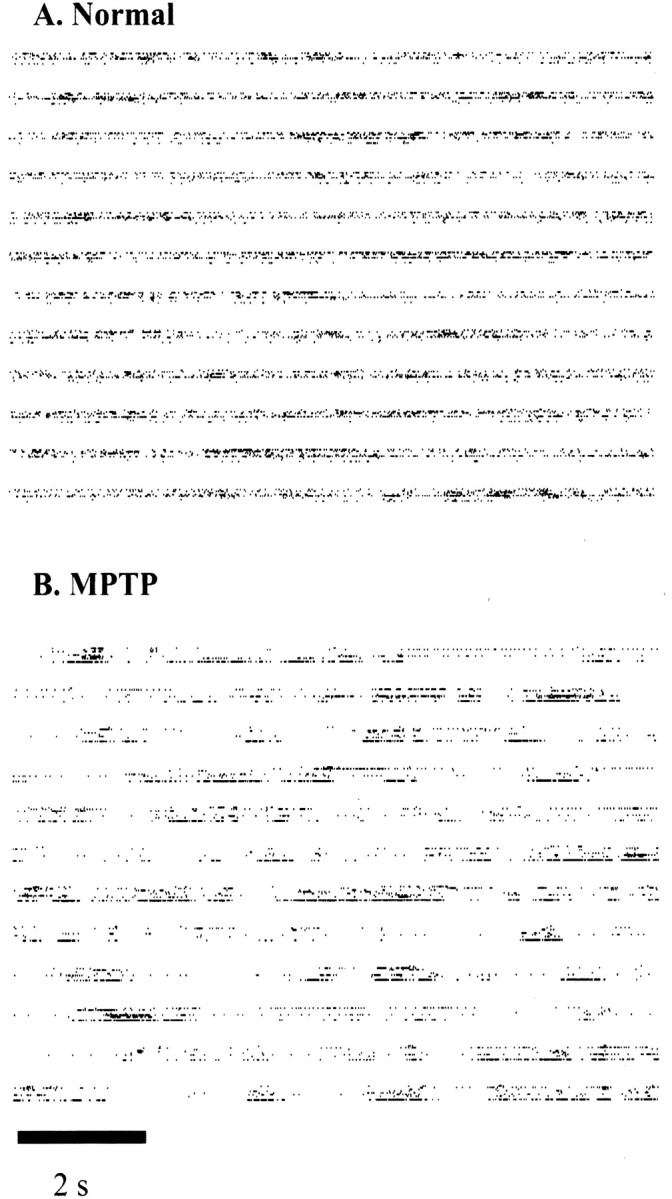
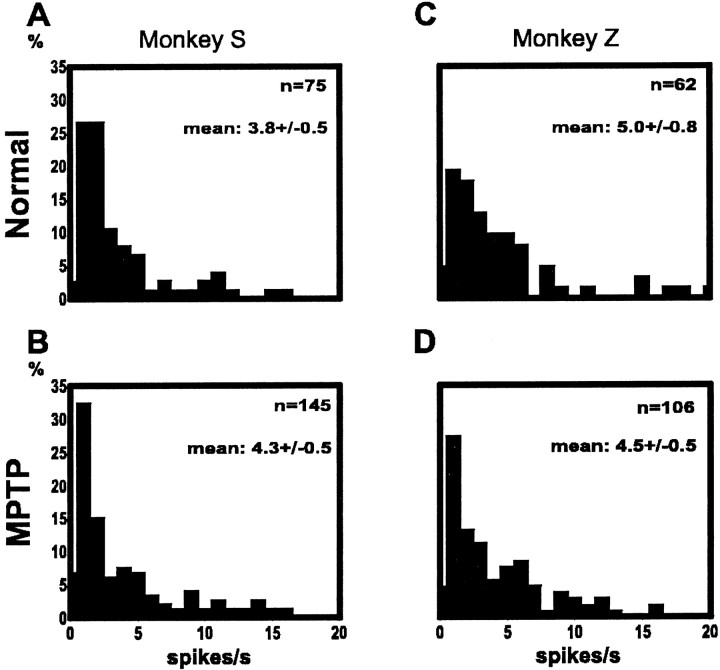
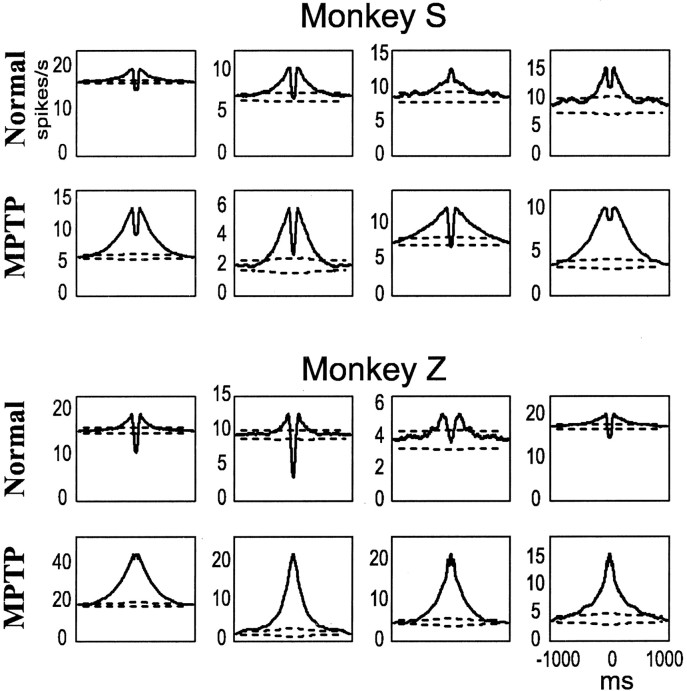
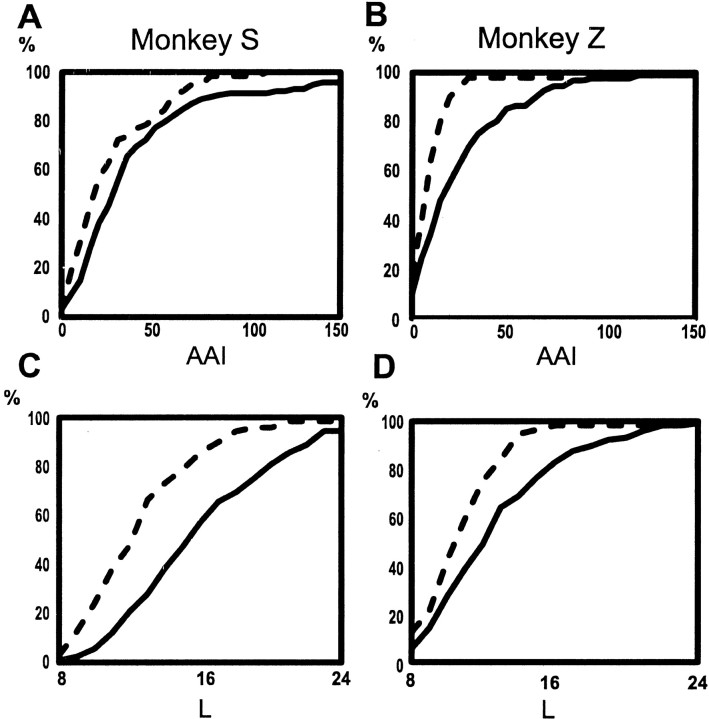
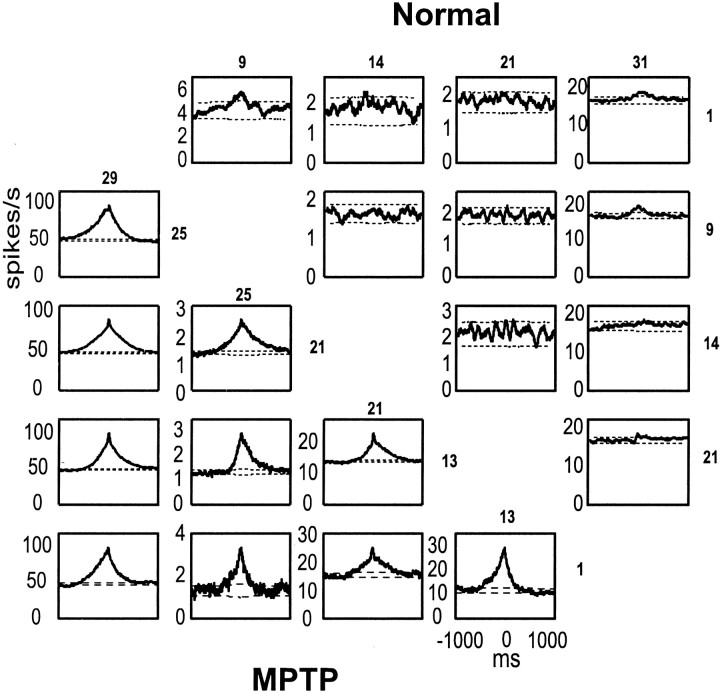
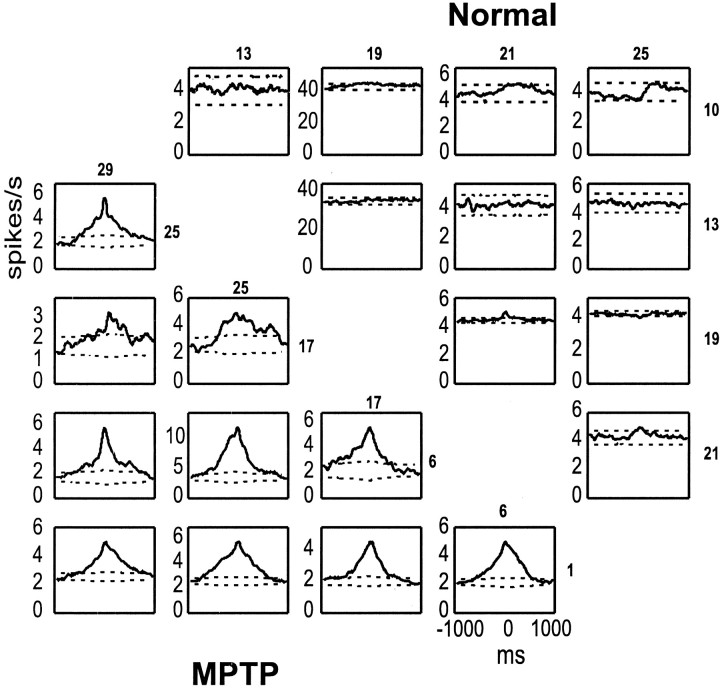
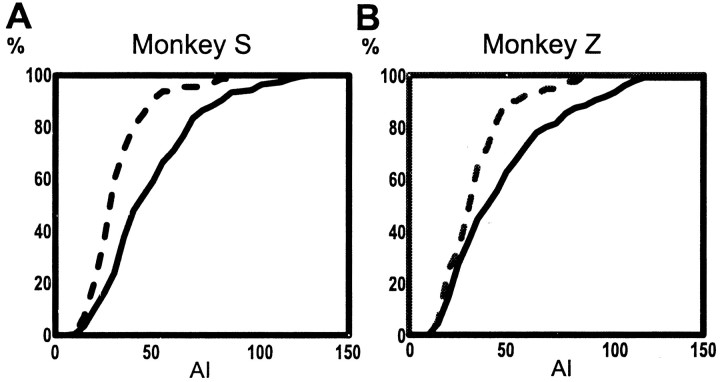
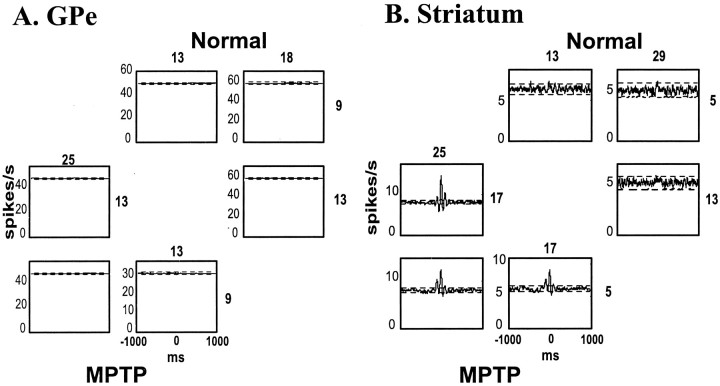
Primary motor cortex (MI) neurons discharge vigorously during voluntary movement. A cardinal symptom of Parkinson's disease (PD) is poverty of movement (akinesia). Current models of PD thus hypothesize that increased inhibitory pallidal output reduces firing rates in frontal cortex, including MI, resulting in akinesia and muscle rigidity. We recorded the simultaneous spontaneous discharge of several neurons in the arm-related area of MI of two monkeys and in the globus pallidus (GP) of one of the two. Accelerometers were fastened to the forelimbs to detect movement, and surface electromyograms were recorded from the contralateral arm of one monkey. The recordings were conducted before and after systemic treatment with 1-methyl-4-phenyl-1,2,3,6-tetrahydropyridine (MPTP), rendering the animals severely akinetic and rigid with little or no tremor. The mean spontaneous MI rates during periods of immobility (four to five spikes/sec) did not change after MPTP; however, in this parkinsonian state, MI neurons discharged in long bursts (sometimes >2 sec long). These bursts were synchronized across many cells but failed to elicit detectable movement, indicating that even robust synchronous MI discharge need not result in movement. These synchronized population bursts were absent from the GP and were on a larger timescale than oscillatory synchrony found in the GP of tremulous MPTP primates, suggesting that MI parkinsonian synchrony arises independently of basal ganglia dynamics. After MPTP, MI neurons responded more vigorously and with less specificity to passive limb movement. Abnormal MI firing patterns and synchronization, rather than reduced firing rates, may underlie PD akinesia and persistent muscle rigidity.


Figures

Fig. 1.
Fig. 1.
Experimental setup: simultaneous recording of multiple electrodes, accelerometers, and surface EMGs. Monkeys were trained to execute a self-initiated button-pressing task. Eight electrodes were lowered to the brain (cortical penetrations depicted). Accelerometers were fastened to both wrists (contralateral working hand depicted) to detect movement. In monkey Z, surface EMG was recorded from the biceps and triceps of the working arm.
Fig. 2.
Fig. 2.
Photomicrographs of tyrosine hydroxylase (TH) (rows 1-4) and Nissl staining (row 5) through the striatum and midbrain of a normal control (A) and the two MPTP-treated animals (B–C); rostral striatum (row 1); central striatum (row 2); and midbrain (rows3 and 4). Row 5depicts the adjacent sections stained for Nissl. Theasterisks in rows 4 and 5mark corresponding blood vessels. Note the lack of TH-positive staining throughout most of the striatum in the MPTP-treated animals. The shell region of the ventral striatum, however, is selectively spared (rows1 and 2). TH-positive cells are selectively lost in the ventral tier (vt,3A, in white). In contrast, cells in the dorsal tier (dt) are selectively spared (row3). Row 4 depicts the magnified views of the boxed areas in row 3. Each region is taken at the border between TH-positive cells and the lack of cells. The photomicrographs from the MPTP-treated animals are taken at a more dorsal level, at the junction between the dorsal and ventral tier cells. The photomicrograph from the normal control animal was taken at the junction between the ventral tier cells and the pars reticulata. The Nissl-stained sections (row 5) demonstrate the lack of neurons in the ventral tier of the MPTP-treated animals. Although in the control animal Nissl-stained neurons are clearly evident, in the MPTP-treated animals a massive glial infiltration has largely replaced the compacta cells.
Fig. 3.
Fig. 3.
Activation patterns of antagonistic muscles in the normal and MPTP states of Monkey Z. A,Normal; B, MPTP.Top, Output of accelerometer attached to the wrist of the working arm. Bottom, EMG recording from biceps and triceps of the working arm. Calibration: horizontal, 1 sec; vertical (accelerometer traces), 0.5 g (=490 cm × sec2). Scale of EMG is arbitrary. Note the tri-phasic pattern of muscle activation (biceps leading) in the normal voluntary movement, in contrast to the completely overlapping co-contraction in the MPTP movements.
Fig. 4.
Fig. 4.
Neuronal discharge in the arm area of MI and contralateral arm movements in the normal and MPTP states of Monkey S.A, Normal; B,MPTP. A, B, Top traces, Extracellular activity recorded from eight electrodes simultaneously.Bottom, Output of accelerometer attached to the contralateral wrist. Bars below the accelerometer trace in A represent active periods of the monkey. Calibration: horizontal, 1 sec; vertical (accelerometer traces), 1g.
Fig. 5.
Fig. 5.
Raster plots of simultaneous spontaneous discharge of 9 units in the normal (A) and MPTP (B) states of monkey Z. In each panel 2 contiguous minutes of data (12 rows of 10 sec each) are depicted. Eachtick is a spike of one cell. Nine cells are depicted in each row. In A, the 2 min are from a period at the beginning of the session wherein the normal monkey sat restfully before the commencement of the behavioral task. In B, data are shown from the akinetic MPTP-treated monkey. Long population bursts (sometimes >2 sec long) separated by relatively quiescent periods are evident in the MPTP state. Calibration: 2 sec.
Fig. 6.
Fig. 6.
Frequency distributions of the mean spontaneous firing rates of MI neurons in the normal immobile (A, C) and the MPTP (B, D) states. A,B, Monkey S; C,D, Monkey Z. Abscissa, spikes per second; ordinate, percentage;n, number of neurons; mean, mean ± SEM of firing rates in spikes per second. There is no significant difference in the population mean spontaneous rate between the normal immobile and the MPTP states (two-sided two-sample ttest; p > 0.45, monkey S; p > 0.5, monkey Z).
Fig. 7.
Fig. 7.
Autocorrelograms of spontaneous discharge of MI neurons in the normal immobile and MPTP states. Solid line, Estimate of the auto-intensity function; dashed line, confidence intervals. Abscissa, Lag shift in milliseconds; range, ±1000 msec; ordinate, conditional discharge rate in spikes per second. The absence of the typical refractory period around time 0 is attributable to the smoothing used.
Fig. 8.
Fig. 8.
Spontaneous neuronal bursting in MI in the normal immobile and MPTP states. A, C,Monkey S; B, D,Monkey Z. A, B, Cumulative frequency distribution of the auto-association index (AAI) of neurons with significant peaks in their autocorrelograms. Dashed line, Normal; solid line, MPTP (abscissa, AAI;ordinate: percentage). The distribution in the MPTP state is shifted to the right, indicating that the AAIs are stochastically greater in this state than in the normal immobile one (two-sided Wilcoxon rank-sum test; monkey S, normal:n = 65, MPTP: n = 119,p < 0.02; monkey Z, normal: n= 51, MPTP: n = 96, p < 104). C,D, Cumulative frequency distribution of theL statistic. L is the size of the set of distinct values attained by the process of rebinning the spike train at its mean ISI. Dashed line, normal; solid line, MPTP (abscissa, L;ordinate, percentage). The distribution in the MPTP state is shifted to the right, indicating that the Lvalues are stochastically greater in this state than in the normal immobile one (two-sided Wilcoxon rank-sum test; monkey S, normal:n = 71, MPTP: n = 125, p < 104; monkey Z, normal:n = 57, MPTP: n = 106, p < 2 × 10³).
Fig. 9.
Fig. 9.
Cross-correlograms of spontaneous discharge of five simultaneously recorded MI neurons in the normal immobile and MPTP states of monkey S. Above diagonal, Normal; below diagonal, MPTP. Solid line, Estimate of conditional rate of the reference cell; dashed line, confidence intervals. Numbers at top of each column, reference cell; numbers to the right of each row, trigger cell.Abscissa, Lag shift in milliseconds; range, ±1000 msec;ordinate, conditional discharge rate in spikes per second.
Fig. 10.
Fig. 10.
Cross-correlograms of the spontaneous discharge of five simultaneously recorded MI neurons in the normal immobile and MPTP states of monkey Z. Format same as in Figure 9.
Fig. 11.
Fig. 11.
Synchronization in arm area of MI in the normal immobile and MPTP states. A, Monkey S.B, Monkey Z. Shown is the cumulative frequency distribution of the association index (AI) of pairs of neurons with significant peaks in their cross-correlograms. Dashed line, Normal;solid line, MPTP (abscissa,AI; ordinate, percentage). The distribution in the MPTP state is shifted to the right, indicating that the AIs are stochastically greater in this state than in the normal immobile one (two-sided Wilcoxon rank-sum test; monkey S, normal:n = 67, MPTP: n = 246, p < 104; monkey Z, normal:n = 40, MPTP: n = 135, p < 0.02).
Fig. 12.
Fig. 12.
Synchronization in the BG of monkey S in the normal immobile and MPTP states. Format same as in Figure 9.A, Examples of cross-correlograms from the GPe. All cross-correlograms, both before and after MPTP, are flat.B, Examples of cross-correlograms from the striatum. Note the 10 Hz oscillatory associations after MPTP (the oscillatory coincidence histograms were smoothed by a 21 msec moving average).
Fig. 13.
Fig. 13.
Frequency distribution of the pooled responses to passive manipulation of the contralateral shoulder, elbow, or wrist as recorded at all cortical penetration sites. A,Monkey S. B, Monkey Z.White bars, Normal. Black bars, MPTP. Neuronal responses were graded as follows: 0 = no response; ? = questionable response;1 = background/hash response; 2= response of cells at foreground. There is a significant shift of the frequency histograms to the right, indicating an increase in the positive responses to passive manipulation and that more responses involved strongly activated single units (χ2; monkey S, normal: n = 213, MPTP: n = 168, p < 104; monkey Z, normal:n = 222, MPTP: n = 183,p < 0.01).

Similar articles

Cited by

References

    1. Albin RL, Young AB, Penney JB. The functional anatomy of basal ganglia disorders. Trends Neurosci. 1989;12:366–375. - PubMed
    1. Alexander GE, DeLong MR, Strick PL. Parallel organization of functionally segregated circuits linking basal ganglia and cortex. Annu Rev Neurosci. 1986;9:357–381. - PubMed
    1. Arthurs OJ, Boniface S. How well do we understand the neural origins of the fMRI BOLD signal? Trends Neurosci. 2002;25:27–31. - PubMed
    1. Asanuma H. The motor cortex. Raven; New York: 1989.
    1. Bar-Gad I, Ritov Y, Vaadia E, Bergman H. Failure in identification of overlapping spikes from multiple neuron activity causes artificial correlations. J Neurosci Methods. 2001;107:1–13. - PubMed

Publication types

MeSH terms

Substances

LinkOut - more resources