. 2002 Jun 1;22(11):4675-85.
doi: 10.1523/JNEUROSCI.22-11-04675.2002.

Priming in macaque frontal cortex during popout visual search: feature-based facilitation and location-based inhibition of return

Affiliations

Priming in macaque frontal cortex during popout visual search: feature-based facilitation and location-based inhibition of return

Narcisse P Bichot et al. J Neurosci. .

Abstract

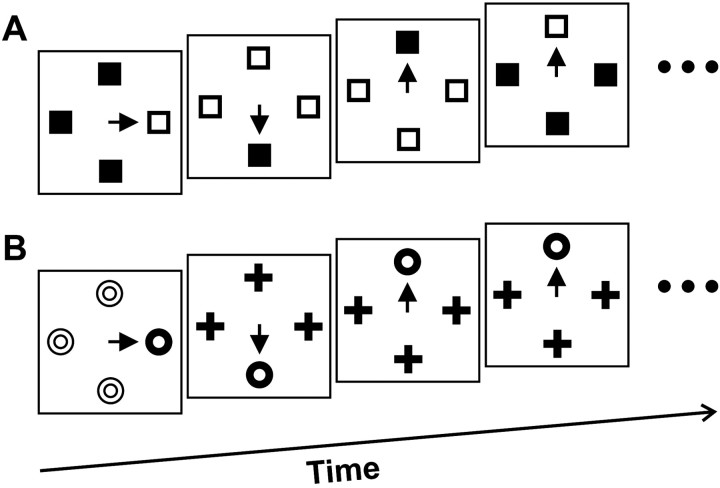
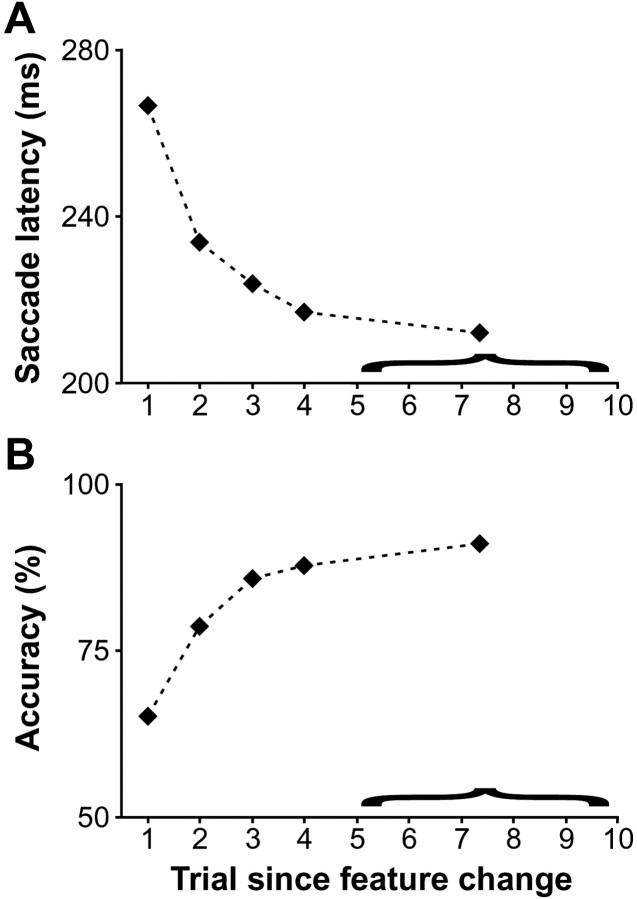
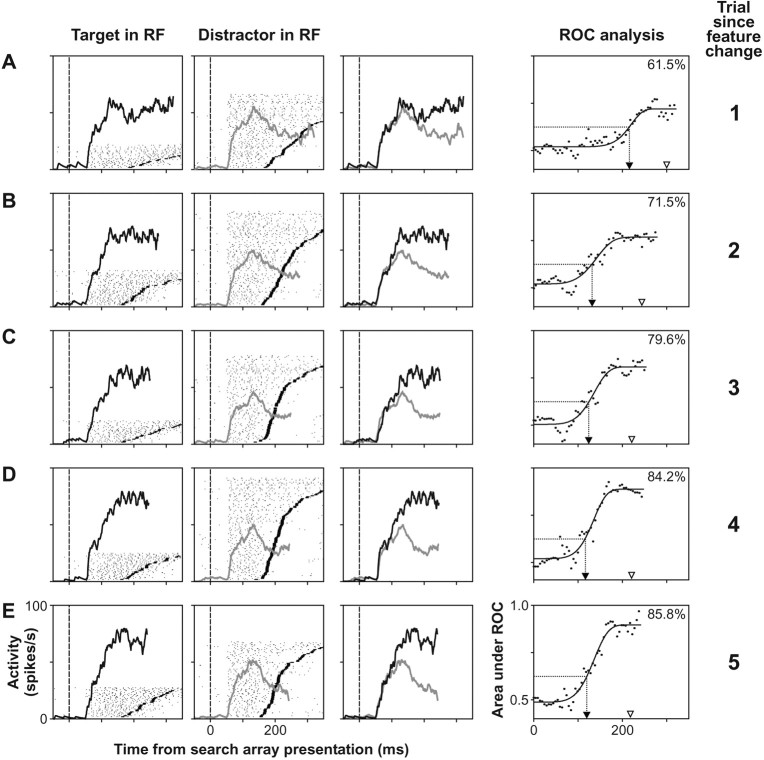
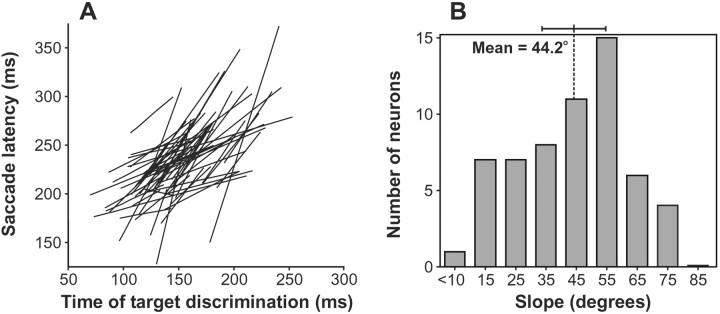
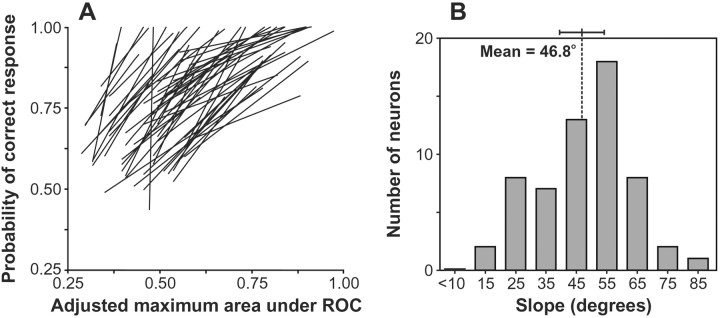
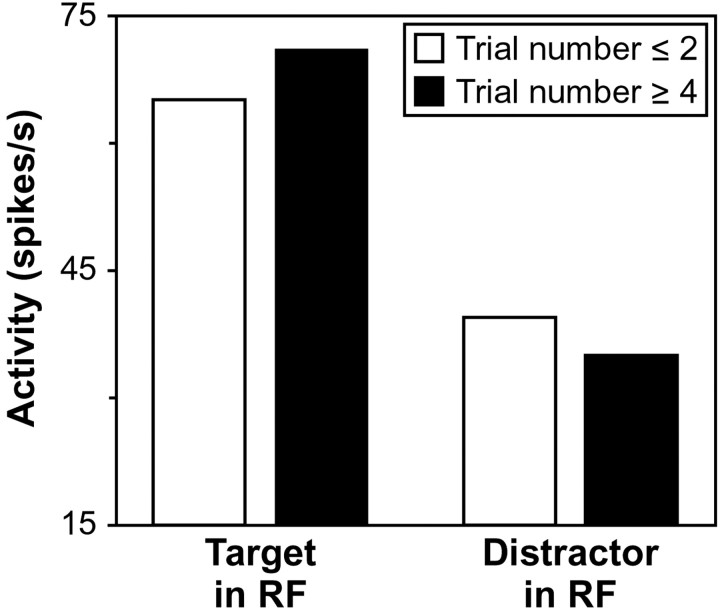
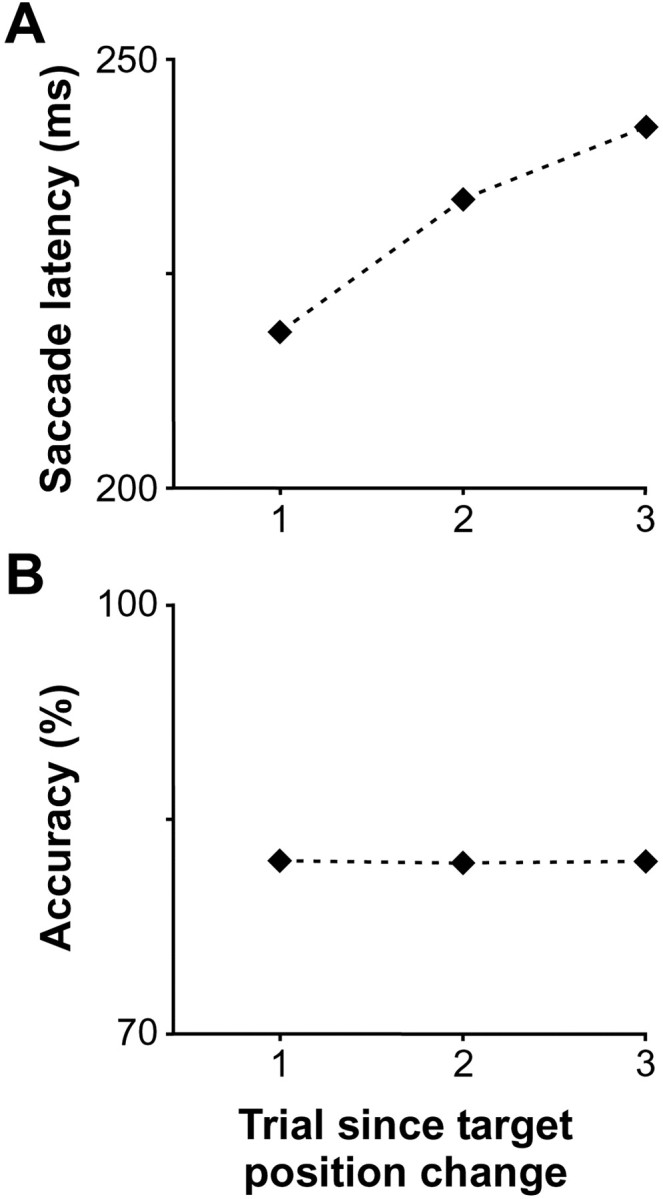
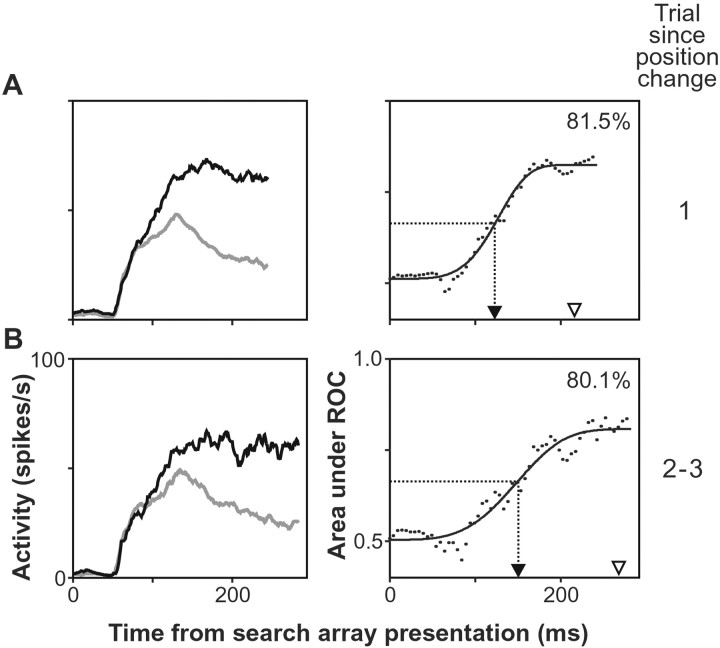
In popout search, humans and monkeys are affected by trial-to-trial changes in stimulus features and target location. The neuronal mechanisms underlying such sequential effects have not been examined. Single neurons were recorded in the frontal eye field (FEF) of monkeys performing a popout search during which stimulus features and target position changed unpredictably across trials. Like previous studies, repetition of stimulus features improved performance. This feature-based facilitation of return was manifested in the target discrimination process in FEF: neurons discriminated the target from distractors earlier and better with repetition of stimulus features, corresponding to improvements in saccade latency and accuracy, respectively. The neuronal target selection was mediated by both target enhancement and distractor suppression. In contrast to the repetition of features, repetition of target position increased saccade latency. This location-based inhibition of return was reflected in the neuronal discrimination process but not in the baseline activity in FEF. These results show adjustments of the target selection process in FEF corresponding to and therefore possibly contributing to changes in performance across trials caused by sequential regularities in display properties.


Figures

Fig. 1.
Fig. 1.
Popout search task. Example sequences of four trials are shown for monkey F (A) and monkey C (B). The monkeys' task was to shift gaze to the target stimulus defined as the color singleton. Thearrow represents the saccade to the target. Stimuli are not drawn to scale.
Fig. 2.
Fig. 2.
Effect of feature change during popout search on performance. The average of median saccade latency (A) and of accuracy (B) across recording sessions is plotted as a function of trial number relative to the change of stimulus features. Data from five or more trials after the change were combined and are represented by the last point in each plot. The average relative separation of these trials with respect to the feature change was 7.4. Note that accuracy always exceeded chance probability of choosing correctly the target, which was 25% for a display with four items.
Fig. 3.
Fig. 3.
Effect of feature change during popout search on the activity of one FEF visuomovement neuron. Activity is shown as a function of trial number after the feature change laid out in rows (A–E). Thus, each row represents an increasing relative trial position with respect to the feature change, with the first row (A) representing activity during the first trial after the change, and the last row (E) representing activity during the fifth trial after the change. Trials after the fifth following the change were not included for illustration purposes. Thefirst and second columns show raster plots of the activity of the neuron when the target or a distractor of the search array was in its response field (RF), respectively. In these plots, each dot represents the time at which an action potential was recorded, eachline of rasters represents the activity on one trial, and the horizontal line in eachraster indicates the time of saccade initiation.Rasters are aligned on the time of search array presentation at time 0 (vertical dashed lines) and are sorted by increasing saccade latency. Superimposed on each raster plot is the average spike density function plotted up to the mean saccade latency; the ordinate scale represents the discharge rate. Only correct trials and spikes that occurred before saccade initiation were used in the computation of the spike density functions and all subsequent analyses. The spike density function of the neuron when the target (black) and distractors (gray) of the search array fell in its receptive field are superimposed in the third column. Therightmost column shows the result of the ROC analysis comparing the distribution of discharge rates during trials when the target fell in the response field of the neuron to the distribution of discharge rates when distractors fell in its response field. In each plot, the vertical dotted line with anarrow pointing toward the abscissa marks the time of target discrimination, which was calculated based on a common threshold used across all trial repetition conditions (see Materials and Methods). The top right corner of each plot shows the percentage of trials the monkey performed correctly for that condition while the neuron was recorded; the arrowheadabove the abscissa marks the median saccade latency for that condition.
Fig. 4.
Fig. 4.
Summary of the relationship between the effect of changing stimulus features on the time course of neuronal discrimination and on saccade latency. For each neuron, we plotted the median saccade latency for each of the five groups of trials described in Figure 2 as a function of the time of neuronal target discrimination for that group of trials (see Materials and Methods). We then determined the total least-squares best-fit line across those five data points. The resulting line for each neuron is plotted in theleft panel (A). The right panel (B) shows the distribution of the angular slope of the best-fit lines. The mean and 95% confidence interval are shown. The strong tendency was a one-to-one relationship.
Fig. 5.
Fig. 5.
Summary of the relationship between the effect of changing stimulus features on the maximal level of neuronal discrimination and on accuracy. For each neuron, we plotted the percentage of correct trials for each of the five groups of trials described in Figure 2 as a function of the maximal asymptotic level of neuronal target discrimination reached for that group of trials (see Materials and Methods). We then determined the total least-squares best-fit line across those five data points. The resulting line for each neuron is plotted in the left panel(A). The right panel(B) shows the distribution of the angular slope of the best-fit lines. The mean and 95% confidence interval are shown. The clear tendency was a one-to-one relationship.
Fig. 6.
Fig. 6.
Target enhancement and distractor suppression during feature priming. Average neuronal activity was computed when neurons were in a steady state of discrimination. Average activation in response to the target in the response field (RF) of a neuron and to distractors in the response field of a neuron is shown during the first two trials after the feature change (white bars) and during the fourth and later trials after the feature change (black bars).
Fig. 7.
Fig. 7.
Effect of popout target position repetition on performance. The average of median saccade latency (A) and of accuracy (B) across sessions is plotted as a function of trial number relative to a change in target position.
Fig. 8.
Fig. 8.
Effect of target position change during popout search on the activity of the FEF visuomovement neuron depicted in Figure 3. The first row of plots (A) illustrates activity during trials in which the target position changed. The second row of plots (B) shows activity during trials in which the target position remained the same with respect to the previous trial. The spike density function of the neuron when the target (black) and distractors (gray) of the search array fell in its receptive field are superimposed in the left column. Theright column of plots shows the result of the ROC analysis comparing the distribution of discharge rates during trials when the target fell in the response field of the neuron to the distribution of discharge rates when distractors fell in its response field. Conventions as in Figure 3.
Fig. 9.
Fig. 9.
Summary of the relationship between the effect of repeating the target location on the time course of neuronal discrimination and on saccade latency. For each neuron, we plotted the median saccade latency for each of the two groups of trials described in Figure 8 as a function of the time of neuronal target discrimination for that group of trials. The line connecting these two points is plotted for each neuron in the left panel(A). The right panel(B) shows the distribution of the angular slope of these lines. The mean and 95% confidence interval are shown.

Similar articles

Cited by

References

    1. Basso MA, Wurtz RH. Modulation of neuronal activity in superior colliculus by changes in target probability. J Neurosci. 1998;18:7519–7534. - PMC - PubMed
    1. Batschelet E. Circular statistics in biology. Academic; New York: 1981.
    1. Bichot NP. Attention, eye movements, and neurons: linking physiology and behavior. In: Harris LR, Jenkin MR, editors. Vision and attention. Springer; New York: 2001a. pp. 209–232.
    1. Bichot NP (2001b) Neural mechanisms of top-down selection during visual search. 23rd Annual International Conference of the IEEE Engineering in Medicine and Biology Society, Istanbul, Turkey, October.
    1. Bichot NP, Schall JD. Saccade target selection in macaque during feature and conjunction visual search. Vis Neurosci. 1999a;16:81–89. - PubMed

Publication types

LinkOut - more resources