

Effects of prolonged waking-auditory stimulation on electroencephalogram synchronization and cortical coherence during subsequent slow-wave sleep
- PMID: 12040077
- PMCID: PMC6758780
- DOI: 10.1523/JNEUROSCI.22-11-04702.2002
Effects of prolonged waking-auditory stimulation on electroencephalogram synchronization and cortical coherence during subsequent slow-wave sleep
Abstract
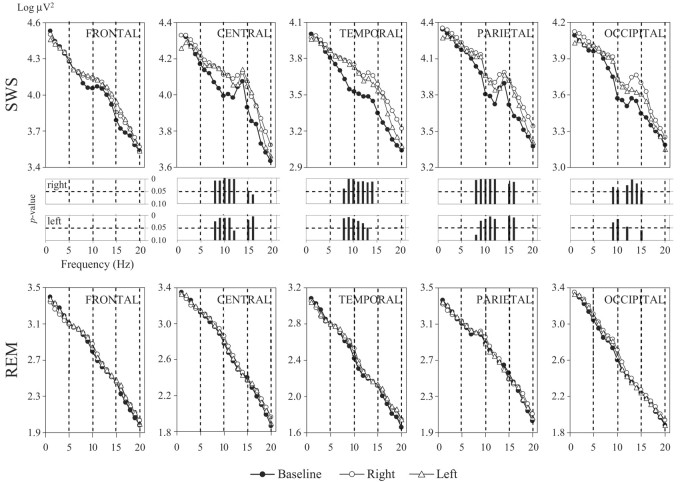
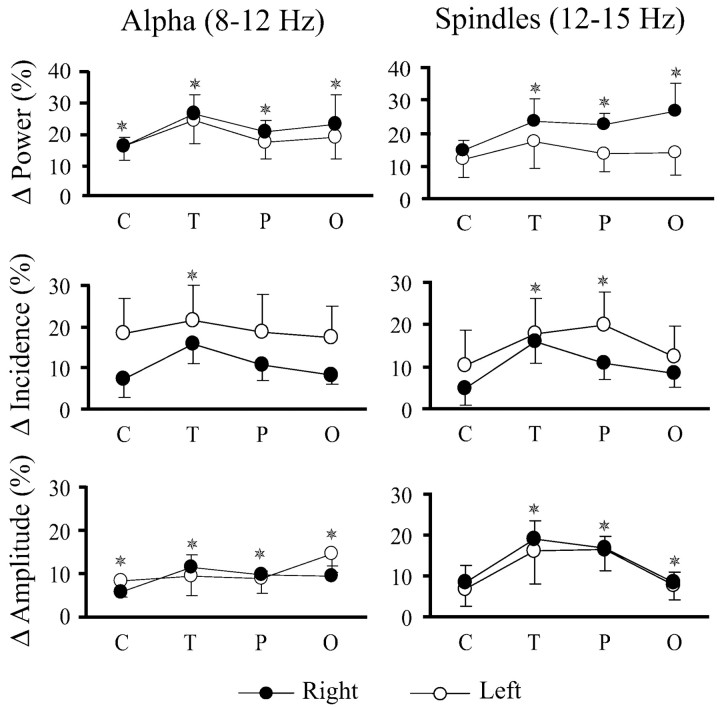
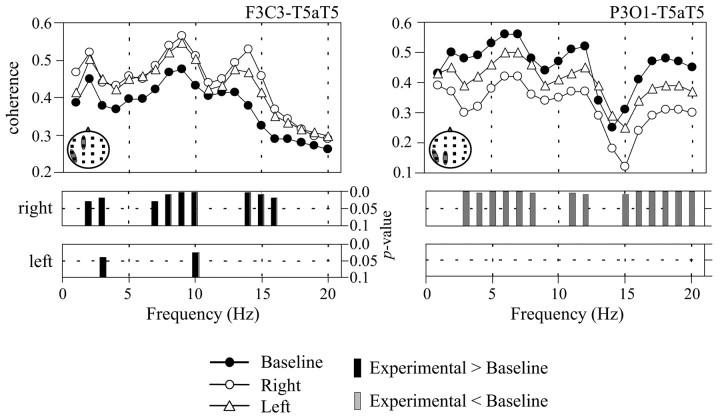
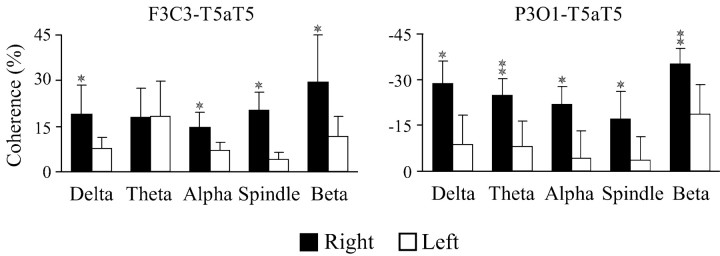
Evidence suggests that sleep homeostasis is not only dependent on duration of previous wakefulness but also on experience- and/or use-dependent processes. Such homeostatic mechanisms are reflected by selective increases in the duration of a sleep stage, modifications to electrophysiological-metabolic brain patterns in specific sleep states, and/or reactivation to neuronal ensembles in subsequent sleep periods. Use-dependent sleep changes, apparently different from those changes caused by memory consolidation processes, are thought to reflect neuronal restoration processes after the sustained exposure to stimulation during the preceding wakefulness. In the present study, we investigated changes in the brain electrical activity pattern during human sleep after 6 hr of continuous auditory stimulation during previous wakefulness. Poststimulation nights showed a widespread increase of spectral power within the alpha (8-12 Hz) and sleep spindle (12-15 Hz) frequency range during slow-wave sleep (SWS) compared with the baseline night. This effect was mainly attributable to an enhanced EEG amplitude rather than an increase of oscillations, except for temporal (within alpha and sleep spindles) and parietal regions (within sleep spindles) in which both parameters contributed equally to the increase of spectral energy. Power increments were accompanied by a strengthening of the coherence between fronto-temporal cortical regions within a broad frequency range during SWS but to the detriment of the coherence between temporal and parieto-occipital areas, suggesting underlying compensatory mechanisms between temporal and other cortical regions. In both cases, coherence was built up progressively across the night, although no changes were observed within each SWS period. No electrophysiological changes were found in rapid eye movement sleep. These results point to SWS as a critical brain period for correcting the cortical synaptic imbalance produced by the predominant use of specific neuronal populations during the preceding wakefulness, as well as for synaptic reorganization after prolonged exposure to a novel sensory experience.
Figures
Similar articles
-
Sleep homeostasis and cortical synchronization: I. Modeling the effects of synaptic strength on sleep slow waves.Sleep. 2007 Dec;30(12):1617-30. doi: 10.1093/sleep/30.12.1617. Sleep. 2007. PMID: 18246972 Free PMC article.
-
Electrophysiological correlates of sleep homeostasis in freely behaving rats.Prog Brain Res. 2011;193:17-38. doi: 10.1016/B978-0-444-53839-0.00002-8. Prog Brain Res. 2011. PMID: 21854953 Free PMC article. Review.
-
A postsleep decline in auditory evoked potential amplitude reflects sleep homeostasis.Clin Neurophysiol. 2011 Aug;122(8):1549-55. doi: 10.1016/j.clinph.2011.01.041. Epub 2011 Mar 21. Clin Neurophysiol. 2011. PMID: 21420904 Free PMC article.
-
High-density EEG characterization of brain responses to auditory rhythmic stimuli during wakefulness and NREM sleep.Neuroimage. 2018 Apr 1;169:57-68. doi: 10.1016/j.neuroimage.2017.12.007. Epub 2017 Dec 6. Neuroimage. 2018. PMID: 29217404 Free PMC article.
-
Neuronal plasticity in thalamocortical networks during sleep and waking oscillations.Neuron. 2003 Feb 20;37(4):563-76. doi: 10.1016/s0896-6273(03)00065-5. Neuron. 2003. PMID: 12597855 Review.
Cited by
-
Learning increases human electroencephalographic coherence during subsequent slow sleep oscillations.Proc Natl Acad Sci U S A. 2004 Sep 21;101(38):13963-8. doi: 10.1073/pnas.0402820101. Epub 2004 Sep 8. Proc Natl Acad Sci U S A. 2004. PMID: 15356341 Free PMC article.
-
Memory traces of long-range coordinated oscillations in the sleeping human brain.Hum Brain Mapp. 2015 Jan;36(1):67-84. doi: 10.1002/hbm.22613. Epub 2014 Aug 20. Hum Brain Mapp. 2015. PMID: 25139521 Free PMC article.
-
Daytime naps, motor memory consolidation and regionally specific sleep spindles.PLoS One. 2007 Apr 4;2(4):e341. doi: 10.1371/journal.pone.0000341. PLoS One. 2007. PMID: 17406665 Free PMC article.
-
How Sleep Shapes Thalamocortical Circuit Function in the Visual System.Annu Rev Vis Sci. 2019 Sep 15;5:295-315. doi: 10.1146/annurev-vision-091718-014715. Epub 2019 Jul 5. Annu Rev Vis Sci. 2019. PMID: 31283451 Free PMC article. Review.
-
Sleep and olfactory cortical plasticity.Front Behav Neurosci. 2014 Apr 22;8:134. doi: 10.3389/fnbeh.2014.00134. eCollection 2014. Front Behav Neurosci. 2014. PMID: 24795585 Free PMC article. Review.
References
-
- Benington JH, Heller HC. Restoration of brain energy metabolism as the function of sleep. Prog Neurobiol. 1995;45:347–360. - PubMed
-
- Borbély AA. A two process model of sleep regulation. Human Neurobiol. 1982;1:195–204. - PubMed
-
- Borbély AA, Baumann F, Brandeis D, Strauch I, Lehmann D. Sleep-deprivation: effect on sleep stages and EEG power density in man. Electroencephalogr Clin Neurophysiol. 1981;51:483–493. - PubMed
-
- Cantero JL, Atienza M, Salas RM. Effects of waking-auditory stimulation on human sleep architecture. Behav Brain Res. 2002;128:53–59. - PubMed
Publication types
MeSH terms
LinkOut - more resources
Full Text Sources