. 2002 Jun 1;22(11):4728-39.
doi: 10.1523/JNEUROSCI.22-11-04728.2002.

Spatial generalization of learning in smooth pursuit eye movements: implications for the coordinate frame and sites of learning

Affiliations

Spatial generalization of learning in smooth pursuit eye movements: implications for the coordinate frame and sites of learning

I-Han Chou et al. J Neurosci. .

Abstract

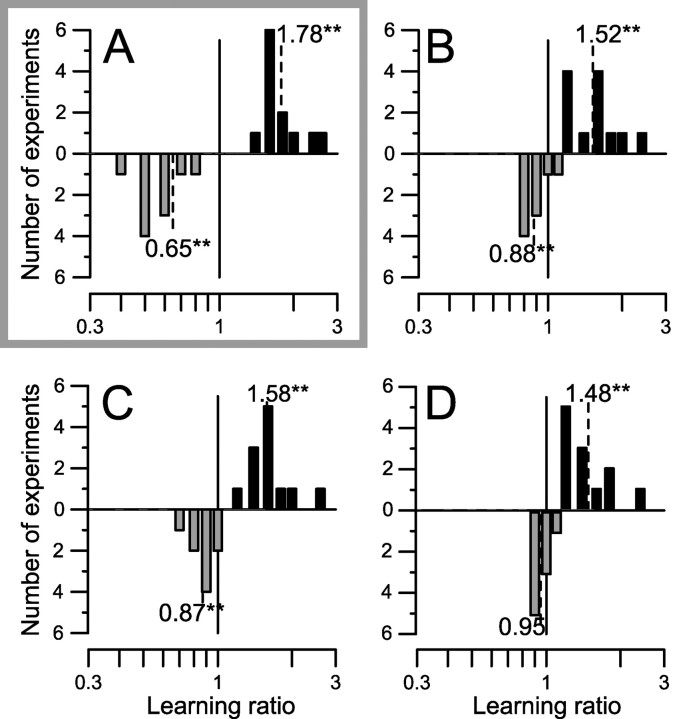
We have examined the underlying coordinate frame for pursuit learning by testing how broadly learning generalizes to different retinal loci and directions of target motion. Learned changes in pursuit were induced using double steps of target speed. Monkeys tracked a target that stepped obliquely away from the point of fixation, then moved smoothly either leftward or rightward. In each experimental session, we adapted the response to targets moving in one direction across one locus of the visual field by changing target speed during the initial catch-up saccade. Learning occurred in both presaccadic and postsaccadic eye velocity. The changes were specific to the adapted direction and did not generalize to the opposite direction of pursuit. To test the spatial scale of learning, we examined the responses to targets that moved across different parts of the visual field at the same velocity as the learning targets. Learning generalized partially to motion presented at untrained locations in the visual field, even those across the vertical meridian. Experiments with two sets of learning trials showed interference between learning at different sites in the visual field, suggesting that pursuit learning is not capable of spatial specificity. Our findings are consistent with the previous suggestions that pursuit learning is encoded in an intermediate representation that is neither strictly sensory nor strictly motor. Our data add the constraint that the site or sites of pursuit learning must process visual information on a fairly large spatial scale that extends across the horizontal and vertical meridians.


Figures

Fig. 1.
Fig. 1.
Schematic representation of the basic learning paradigm. This example experiment was designed to increase rightward eye velocity. Trials began by having the monkey fixate a peripheral spot at the location indicated by the plus signs for 800–1200 msec. A target then appeared in the center of the screen, at the location indicated by the circles, and immediately began to move smoothly to the right or the left. Baseline block: trials present target motion at a single speed to the left or the right. Learning block: 50% of the trials are “learning trials” in which the target moved at one speed before the first saccade and a second speed after the saccade. The remaining trials in the learning block were “probe trials,” in which the target moved in the learning direction but did not change speeds during the saccade and “control trials,” in which the target moved in the opposite direction. Recovery block: same blend of trials as in the baseline block. In all velocity traces, upward and downward deflections represent rightward and leftward target velocities, respectively.
Fig. 2.
Fig. 2.
Examples of eye movements in learning and probe trials before and after learning. A, Increase-velocity learning trials. The target (dashed lines) stepped obliquely away from the fixation point and began moving at 10°/sec. When the computer detected the onset of the first tracking saccade, the target velocity was stepped up to 30°/sec. B, Probe trials from the same experiment as the learning trial. The target moved at a constant 10°/sec. From top tobottom, the traces are as follows: superimposed eye and target velocity and superimposed eye and target position in thebottom figures. Black and gray traces show data from one trial before and after learning, respectively. The pairs of vertical lines on the velocity traces in B show the interval over which we measured postsaccadic eye velocity.T and E represent target and eye data, respectively.
Fig. 3.
Fig. 3.
Summary of effects of learning in postsaccadic eye velocity. A, Demonstration that the postsaccadic analysis interval is driven by visual inputs from before the saccade. The solid traces show the mean eye velocity from learning trials (gray line) and probe trials (black line) from a single experiment. Dashed traces represent SD. Traces to the left andright of the vertical lines show eye velocity aligned to the start and end of the saccade, respectively.B, Postsaccadic eye velocity after learning is plotted as a function of eye velocity at the same time before learning. Each point shows data from one experiment. The y-axis plots the mean eye velocity in the last 20 probe trials in the adaptation block. The x-axis plots the mean eye velocity in the same type of trials in the baseline block. The diagonal line has a slope of one and would obtain if learning caused no change in eye velocity. Squares andtriangles show results of increase-velocity and decrease-velocity experiments, respectively. Filled symbols indicate experiments in which learning caused statistically significant changes in eye velocity (ttest; p < 0.05), and open symbolsshow experiments in which changes were not significant.
Fig. 4.
Fig. 4.
Examples of responses to probe target motion presented in different retinal locations after learning at one location. Each panel superimposes examples of horizontal eye velocity traces from single probe trials before learning (black traces) and after learning (gray traces). The dashed trace shows target velocity in the probe trials. The inset in each graph shows the relative position in the visual field of the probe target, shown by thearrow, and fixation point, shown by the plus sign. A, Probe target is in the same visual field location of the learning stimulus. B, Probe target is in the same vertical visual hemifield as the adapted location.C, Probe target is in the same horizontal visual hemifield as the adapted location. D, Probe target is in opposite visual quadrant to the adapted location. In each trial, the probe target was 7° eccentric in the visual field.
Fig. 5.
Fig. 5.
Generalization of learning to unadapted retinal locations. Each set of histograms shows the distribution of the learning ratio for probe trials in a particular retinal location.Upward black bars and downward gray barsshow results for increase and decrease velocity experiments, respectively. For each distribution, the location of the dashed line and its label give the geometric mean of the learning ratio. The distributions with asterisks after the mean were significantly greater or smaller than 1 (one-sidedt test against 1; p < 0.01).A, Distributions of learning ratio for probe targets at the adapted location. B, Probe targets in the same vertical hemifield but opposite horizontal hemifield to adapted location. C, Probe targets in the same horizontal hemifield but opposite vertical hemifield. D, Probe targets in opposite visual quadrant to adapted stimulus.
Fig. 6.
Fig. 6.
Summary of generalization of learning across quadrants. The learning ratio averaged over all probe trials at unadapted locations in the visual field is plotted against learning ratio of the adapted step. Each symbol shows data for one experiment. Black square and gray triangles plot data for increase-velocity and decrease-velocity experiments, respectively. The two solid lines have slopes of 0 and 1 and would obtain if generalization were absent or complete, respectively.
Fig. 7.
Fig. 7.
Evaluation of the spatial generalization of learning on a finer grid. A, Target configuration for learning generalization experiments. The circles show the different fixation points, and the cross shows the initial position and possible motion of the tracking targets.B, Learning ratio is plotted as a function of the spatial separation between the learning stimulus and the test stimulus.Black and gray symbols show data for increase-velocity and decrease-velocity learning paradigms.Small filled symbols show the learning ratios from each individual experiment. Open symbols connected bylines show the geometric mean of the learning ratios across experiments. The learning stimulus was presented at zero on thex-axis, with represents a position either 5 or 7° eccentric in the visual field in different experiments. Learning ratios generated to increase learning (black squares) and decrease learning (gray triangles). The results have been arranged such that 0 represents the location of the learning stimulus. In some experiments, the learning stimulus was presented when the fixation point was placed 5° from the center, and in others, the fixation point was 7° from center.
Fig. 8.
Fig. 8.
Interference of learning when increase-velocity and decrease-velocity trials were presented at different visual field locations. A, Schematic diagram showing the target velocity (solid traces on theleft) and position (schematic on right) for the learning trials presented during increase-first learning experiments. B, Summary of six increase-first experiments. The first learning block contained increase-velocity learning trials at one location. The second learning block contained increase- velocity trials at the original visual field location and decrease-velocity trials in the opposite quadrant of the visual field.C, Summary of seven decrease-first experiments. The first learning block contained decrease-velocity learning trials at one location. The second learning block contained decrease-velocity trials at the original visual field location and increase-velocity trials in the opposite quadrant of the visual field. In the graphs inB and C, learning ratio is plotted as a function of the position of the test stimulus in the visual field, relative to the location of the learning trials in the first learning block. Thus, the first learning stimulus was located at zero on thex-axis and the second learning stimulus at −10.Black and gray symbols show the generalization of learning after the first and second learning blocks.Small filled symbols show the learning ratios from each individual experiment. Open symbols connected bylines show the geometric mean of the learning ratios across experiments.
Fig. 9.
Fig. 9.
Summary of effects of learning in presaccadic eye velocity. A, Presaccadic eye velocity after learning is plotted as a function of eye velocity at the same time before learning. Each point shows data from one experiment. They-axis plots the mean eye velocity in the last 20 probe trials in the adaptation block. The x-axis plots the mean eye velocity in the same type of trials in the baseline block. Thediagonal line has a slope of one and would obtain if learning caused no change in eye velocity. Squares andtriangles show results of increase-velocity and decrease-velocity experiments, respectively. Filled symbols indicate experiments in which learning caused statistically significant changes in eye velocity (ttest; p < 0.05), and open symbols show experiments in which changes were not significant.B, Example of the time course of acquisition of presaccadic and postsaccadic pursuit learning from a single increase-velocity experiment. The x-axis plots the number of times the learning stimulus was presented, and they-axis plots eye velocity. Each data point shows eye velocity from one single learning trial. Filled andopen symbols show average eye velocity across the 10 msec immediately before or after the saccade. The two single symbols with error bars on the left side of the graph show the mean and SDs of presaccadic and postsaccadic velocity taken from probe trials in the baseline block.
Fig. 10.
Fig. 10.
Lack of generalization of learning to target motion in the control direction. Each point represents data from one learning experiment, either designed to increase (squares) or decrease eye velocity (triangles). The axes shows the ratio of mean post-saccadic eye velocity after learning divided by mean eye velocity before learning. The x-axis shows the ratio for the adapted direction, and the y-axis shows the ratio for the opposite, unadapted direction.

Similar articles

Cited by

References

    1. Carl JR, Gellman RS. Human smooth pursuit: stimulus-dependent responses. J Neurophysiol. 1987;57:1446–1463. - PubMed
    1. Chou IH, Lisberger SG. Spatial generalization of learning in smooth pursuit eye movements. Soc Neurosci Abstr. 2000;26:641.617. - PMC - PubMed
    1. Desimone R, Ungerleider LG. Multiple visual areas in the caudal superior temporal sulcus of the macaque. J Comp Neurol. 1986;248:164–189. - PMC - PubMed
    1. Ferrera VP, Lisberger SG. Neuronal responses in visual areas MT and MST during smooth pursuit target selection. J Neurophysiol. 1997;78:1433–1446. - PubMed
    1. Gattass R, Gross CG. Visual topography of striate projection zone (MT) in posterior superior temporal sulcus of the macaque. J Neurophysiol. 1981;46:621–638. - PubMed

Publication types

LinkOut - more resources