

Nitric oxide inhibits neuroendocrine Ca(V)1 L-channel gating via cGMP-dependent protein kinase in cell-attached patches of bovine chromaffin cells
- PMID: 12042344
- PMCID: PMC2290346
- DOI: 10.1113/jphysiol.2002.017749
Nitric oxide inhibits neuroendocrine Ca(V)1 L-channel gating via cGMP-dependent protein kinase in cell-attached patches of bovine chromaffin cells
Abstract
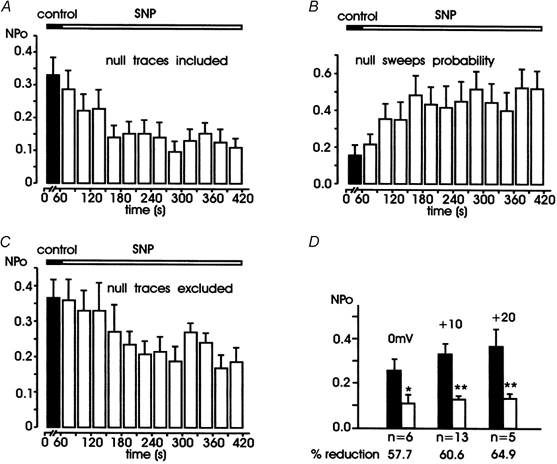
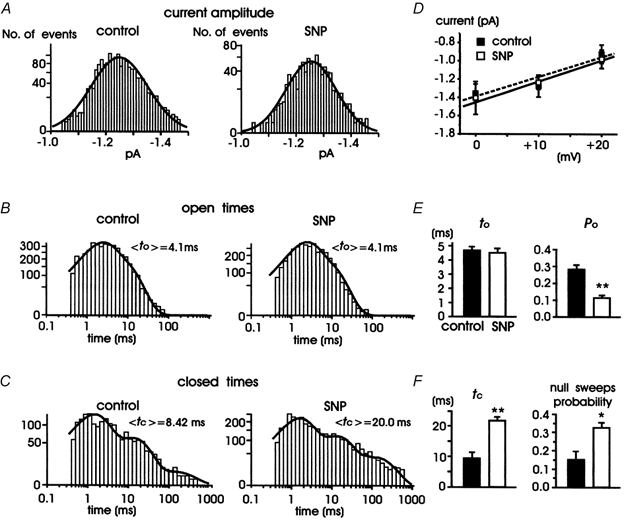
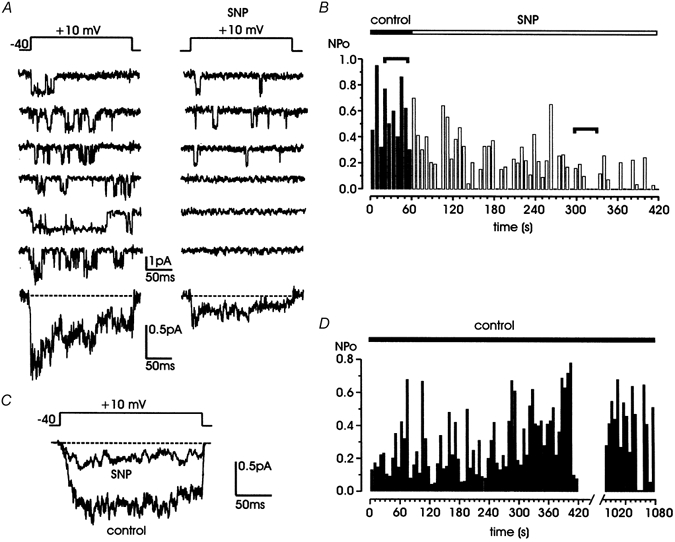
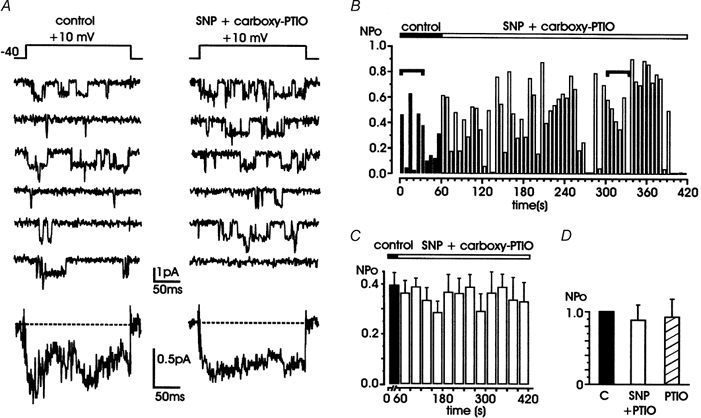
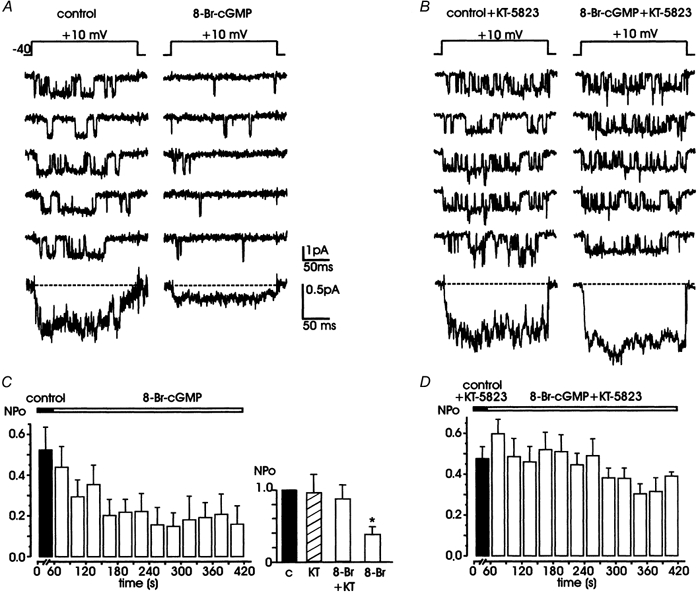
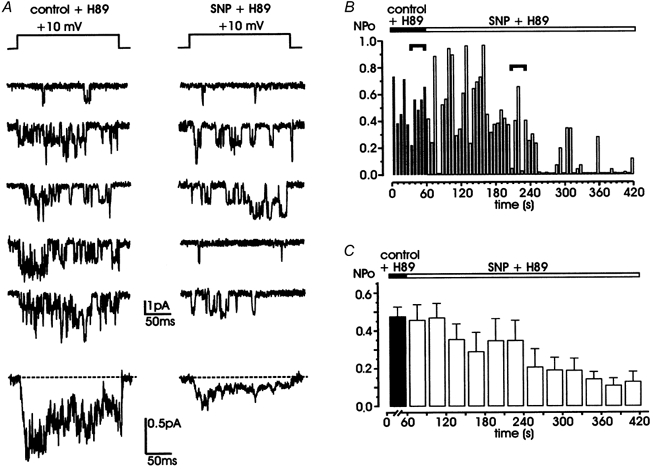
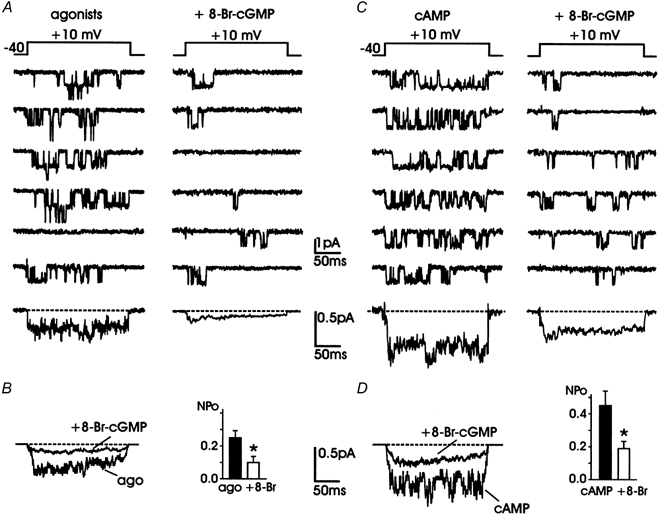
Nitric oxide (NO) regulates the release of catecholamines from the adrenal medulla but the molecular targets of its action are not yet well identified. Here we show that the NO donor sodium nitroprusside (SNP, 200 microM) causes a marked depression of the single Ca(V)1 L-channel activity in cell-attached patches of bovine chromaffin cells. SNP action was complete within 3-5 min of cell superfusion. In multichannel patches the open probability (NP(o)) decreased by approximately 60 % between 0 and +20 mV. Averaged currents over a number of traces were proportionally reduced and showed no drastic changes to their time course. In single-channel patches the open probability (P(o)) at +10 mV decreased by the same amount as that of multichannel patches (approximately 61 %). Such a reduction was mainly associated with an increased probability of null sweeps and a prolongation of mean shut times, while first latency, mean open time and single-channel conductance were not significantly affected. Addition of the NO scavenger carboxy-PTIO or cell treatment with the guanylate cyclase inhibitor ODQ prevented the SNP-induced inhibition. 8-Bromo-cyclicGMP (8-Br-cGMP; 400 microM) mimicked the action of the NO donor and the protein kinase G blocker KT-5823 prevented this effect. The depressive action of SNP was preserved after blocking the cAMP-dependent up-regulatory pathway with the protein kinase A inhibitor H89. Similarly, the inhibitory action of 8-Br-cGMP proceeded regardless of the elevation of cAMP levels, suggesting that cGMP/PKG and cAMP/PKA act independently on L-channel gating. The inhibitory action of 8-Br-cGMP was also independent of the G protein-induced inhibition of L-channels mediated by purinergic and opiodergic autoreceptors. Since Ca(2+) channels contribute critically to both the local production of NO and catecholamine release, the NO/PKG-mediated inhibition of neuroendocrine L-channels described here may represent an important autocrine signalling mechanism for controlling the rate of neurotransmitter release from adrenal glands.
Figures
 ). All the patches contained multichannel openings.
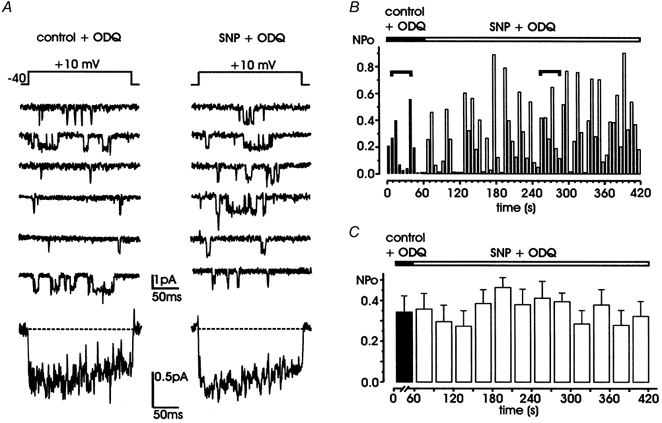
Similar articles
-
cGMP/protein kinase G-dependent inhibition of N-type Ca2+ channels induced by nitric oxide in human neuroblastoma IMR32 cells.J Neurosci. 2002 Sep 1;22(17):7485-92. doi: 10.1523/JNEUROSCI.22-17-07485.2002. J Neurosci. 2002. PMID: 12196571 Free PMC article.
-
Modulation of voltage-gated Ca2+ current in vestibular hair cells by nitric oxide.J Neurophysiol. 2007 Feb;97(2):1188-95. doi: 10.1152/jn.00849.2006. Epub 2006 Dec 20. J Neurophysiol. 2007. PMID: 17182910
-
Nitric oxide inhibits L-type Ca2+ current in glomus cells of the rabbit carotid body via a cGMP-independent mechanism.J Neurophysiol. 1999 Apr;81(4):1449-57. doi: 10.1152/jn.1999.81.4.1449. J Neurophysiol. 1999. PMID: 10200181
-
G-protein- and cAMP-dependent L-channel gating modulation: a manyfold system to control calcium entry in neurosecretory cells.Pflugers Arch. 2001 Sep;442(6):801-13. doi: 10.1007/s004240100607. Pflugers Arch. 2001. PMID: 11680611 Review.
-
Cav1.3 and Cav1.2 channels of adrenal chromaffin cells: emerging views on cAMP/cGMP-mediated phosphorylation and role in pacemaking.Biochim Biophys Acta. 2013 Jul;1828(7):1608-18. doi: 10.1016/j.bbamem.2012.11.013. Epub 2012 Nov 15. Biochim Biophys Acta. 2013. PMID: 23159773 Review.
Cited by
-
Distinct potentiation of L-type currents and secretion by cAMP in rat chromaffin cells.Biophys J. 2003 Aug;85(2):1326-37. doi: 10.1016/S0006-3495(03)74567-6. Biophys J. 2003. PMID: 12885675 Free PMC article.
-
Hypoxia inducible factor-1 improves the negative functional effects of natriuretic peptide and nitric oxide signaling in hypertrophic cardiac myocytes.Life Sci. 2010 Jul 3;87(1-2):9-16. doi: 10.1016/j.lfs.2010.05.002. Epub 2010 May 12. Life Sci. 2010. PMID: 20470788 Free PMC article.
-
PDE type-4 inhibition increases L-type Ca(2+) currents, action potential firing, and quantal size of exocytosis in mouse chromaffin cells.Pflugers Arch. 2009 Mar;457(5):1093-110. doi: 10.1007/s00424-008-0584-4. Epub 2008 Sep 9. Pflugers Arch. 2009. PMID: 18779976
-
Functional chromaffin cell plasticity in response to stress: focus on nicotinic, gap junction, and voltage-gated Ca2+ channels.J Mol Neurosci. 2012 Oct;48(2):368-86. doi: 10.1007/s12031-012-9707-7. Epub 2012 Jan 18. J Mol Neurosci. 2012. PMID: 22252244 Free PMC article. Review.
-
Autocatalytic loop, amplification and diffusion: a mathematical and computational model of cell polarization in neural chemotaxis.PLoS Comput Biol. 2009 Aug;5(8):e1000479. doi: 10.1371/journal.pcbi.1000479. Epub 2009 Aug 28. PLoS Comput Biol. 2009. PMID: 19714204 Free PMC article.
References
-
- Aizenman E, Brimecombe JC, Potthoff WK, Rosenberg PA. Why is the role of nitric oxide in NMDA receptor function and dysfunction so controversial? Progress in Brain Research. 1998;118:53–71. - PubMed
-
- Barry PH, Lynch JW. Liquid junction potentials and small cell effects in patch-clamp analysis. Journal of Membrane Biology. 1991;121:101–117. - PubMed
-
- Bates JN, Baker MT, Guerra R, Harrison DG. Nitric oxide generation from nitroprusside by vascular tissue. Evidence that reduction of the nitroprusside anion and cyanide loss are required. Biochemical Pharmacology. 1991;42:S157–165. - PubMed
-
- Bell DC, Butcher AJ, Berrow NS, Page KM, Brust PF, Nesterova A, Stauderman KA, Seabrook GR, Nürnberg B, Dolphin AC. Biophysical properties, pharmacology, and modulation of human, neuronal L-Type (α1D, CaV1. 3) voltage-dependent calcium currents. Journal of Neurophysiology. 2001;85:816–827. - PubMed
-
- Bolotina VM, Najibi S, Palacino JJ, Pagano PJ, Cohen RA. Nitric oxide directly activates calcium-dependent potassium channels in vascular smooth muscle. Nature. 1994;368:850–853. - PubMed
MeSH terms
Substances
LinkOut - more resources
Full Text Sources
Miscellaneous