. 2002 Jun 1;541(Pt 2):467-82.
doi: 10.1113/jphysiol.2001.018333.

Potassium channels Kv1.1, Kv1.2 and Kv1.6 influence excitability of rat visceral sensory neurons

Affiliations

Potassium channels Kv1.1, Kv1.2 and Kv1.6 influence excitability of rat visceral sensory neurons

Patricia A Glazebrook et al. J Physiol. .

Abstract

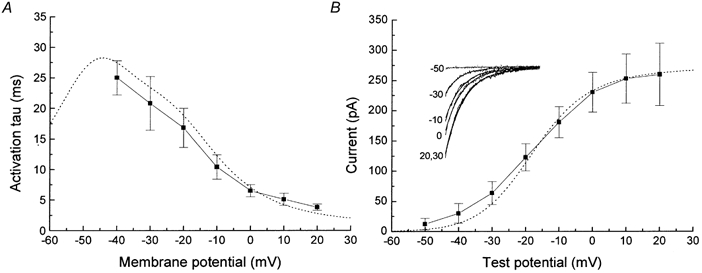
Voltage-gated potassium channels, Kv1.1, Kv1.2 and Kv1.6, were identified as PCR products from mRNA prepared from nodose ganglia. Immunocytochemical studies demonstrated expression of the proteins in all neurons from ganglia of neonatal animals (postnatal days 0-3) and in 85-90 % of the neurons from older animals (postnatal days 21-60). In voltage clamp studies, alpha-dendrotoxin (alpha-DTX), a toxin with high specificity for these members of the Kv1 family, was used to examine their contribution to K(+) currents of the sensory neurons. alpha-DTX blocked current in both A- and C-type neurons. The current had characteristics of a delayed rectifier with activation positive to -50 mV and little inactivation during 250 ms pulses. In current-clamp experiments alpha-DTX, used to eliminate the current, had no effect on resting membrane potential and only small effects on the amplitude and duration of the action potential of A- and C-type neurons. However, there were prominent effects on excitability. alpha-DTX lowered the threshold for initiation of discharge in response to depolarizing current steps, reduced spike after-hyperpolarization and increased the frequency/pattern of discharge of A- and C-type neurons at membrane potentials above threshold. Model simulations were consistent with these experimental results and demonstrated how the other major K(+) currents function in response to the loss of the alpha-DTX-sensitive current to effect these changes in action potential wave shape and discharge.


Figures

Figure 1
Figure 1. Expression of Kv1.1, Kv1.2, Kv1.6 and Kvβ subunit mRNA in rat nodose ganglia and brain
A, Kv1.1, Kv1.2 and Kv1.6 channel mRNAs are expressed in nodose ganglia. PCR products, resulting from the amplification of first-strand cDNA prepared with (+) or without (-) reverse transcriptase (RT) from nodose ganglia or brain poly A+ RNA with Kv1.1, Kv1.2 or Kv1.6 specific oligomers, were separated by electrophoresis and transferred to nylon membranes. After Southern hybridization with 32P-labelled specific internal oligomers (see Methods), the autoradiogram showed positive signals for all three channels from nodose and rat brain in the (+)-RT lanes with no signals in the control (-)-RT lanes. B, Northern blot analysis of Kvβ1.2 expression in adult rat nodose ganglia and brain. RNA size markers are indicated on the left. As shown, brain exhibited a single band of ∼5 kb that hybridized with a Kvβ1.2 specific riboprobe, a band that is not present in nodose ganglia. C, RT-PCR analysis of the expression of Kvβ1.1, Kvβ1.3, Kvβ2 and Kvβ3 subunits in rat brain and nodose ganglia. As a control, first-strand cDNA reactions were performed either with (+) or without (-) RT. The oligonucleotide probes amplify a cDNA of 323 bp for Kvβ1.1, 182 bp for Kvβ1.3, 524 bp for Kvβ2 and 515 bp for Kvβ3.
Figure 2
Figure 2. Kv1.1, Kv1.2 and Kv1.6 are detected in Western blots of nodose ganglia and brain protein
Western blots of channel expression in nodose ganglia (A, B and C), brain lysates (A and B) and brain crude membrane fraction (C) probed with monoclonal anti-Kv1.1 (A), monoclonal anti-Kv1.2 (B) and polyclonal anti-Kv1.6 (C) (50 μg protein per lane). Immunoreactive bands were visualized with ECL-Plus (Amersham Pharmacia Biotech). Molecular weight markers (kDa) are indicated on the left.
Figure 3
Figure 3. The localization of Kv1.1, Kv1.2 and Kv1.6 immunoreactivity
A, left panels show confocal single slice images through isolated neonatal nodose neurons labelled with Kv1.1 (top), Kv1.2 (middle) and Kv1.6 (bottom). The arrows indicate some regions where patches of immunoreactivity appear at the cell membrane. Differential interference contrast (DIC) images of the cells appear in insets in each panel. Right panels show preabsorption controls with the immunizing fusion protein for the three antibodies. B, expression of Kv1.1, Kv1.2 and Kv1.6 in superior laryngeal sensory neurons is shown with conventional fluorescent microscopy of 6 μm sections through the nodose ganglion. The Cm-DiI label was co-localized with the potassium channel antibodies (green) to give a yellow-orange colour. These images were digitally recorded as single labels and then superimposed. These figures also illustrate a wide distribution in the level of immunoreactivity among the neurons. The arrows in the upper panel show that Kv1.1 immunoreactivity is also found in pericytes surrounding the neurons. The section in the middle panel contains a group of nerve fibres. The arrowhead indicates Kv1.2 immunoreactivity in the juxta-paranodal regions of a myelinated fibre and the double-headed arrow indicates immunoreactivity distributed along a finer fibre. In all panels the asterisks identify neurons containing DiI.
Figure 4
Figure 4. Effect of α-DTX on potassium currents
In the left panel experimental data illustrate an example of current in a baroreceptor C-type neuron elicited by a series of 250 ms polarizing pulses from to −100 to +30 mV in 10 mV steps from a holding potential of −80 mV in the absence (A) and presence (B) of 50 nm α-DTX. The α-DTX-sensitive current (C) was obtained by subtracting B from A. D shows the composite of current-voltage relationships of α-DTX-sensitive current of 8 neurons where voltage steps were delivered in 5 mV steps. The inset illustrates the concentration-response relationship for 5 neurons. Capacitance was not compensated in the experiment shown in A. The right panel illustrates the model-derived whole-cell K+ current data matched to the experimental data presented on the left. Maximum whole-cell K+ conductances were as follows (all in nS): gdtx = 7.5, g4-AP = 37.5, gK,Ca = 7.5 and gK = 17.5.
Figure 5
Figure 5. Characteristics of activation
A, the voltage dependence of the activation times was obtained by a single exponential fit to the rising phase of the α-DTX-sensitive current at each potential. B, voltage dependence of activation was obtained from tail current measurements at −100 mV following 10 mV depolarizing steps to −70 to +20 mV from a holding potential of −90 mV. The model simulation of the data is indicated by the dotted lines in A and B. A non-linear parameter estimation technique was used to identify forward and reverse voltage-dependent rate constants that produced the best least-squares fit to the α-DTX-sensitive K+ current data.
Figure 6
Figure 6. Sensitivity to 4-AP and TEA
A, α-DTX-sensitive current is a subcomponent of the 4-AP-sensitive current. The current-voltage relationship was obtained at the end of the voltage pulse, as in Fig. 4 in control conditions (▾), after addition of 50 nm α-DTX (▴), followed by 5 mm 4-AP after washing the DTX (▪) and subsequent addition of α-DTX to the 4-AP perfusion (•). Addition of α-DTX in presence of 4-AP produced no further inhibition of the current. B, the α-DTX-sensitive current is a subcomponent of the TEA-sensitive current. Addition of α-DTX in the presence of 5 mm TEA (•) produced no further inhibition from that seen in the presence of 5 mm TEA alone (▪), although the cells were shown to be sensitive to α-DTX (▴). The insets in A and B give the model-derived current-voltage relationships for the total K+ current and the total K+ current minus the α-DTX-sensitive component (DTX) and either both the α-DTX- and 4-AP-sensitive currents (4-AP + DTX in A) or both the α-DTX- and TEA-sensitive currents (DTX + TEA in B). Model parameters and maximum whole-cell K+ conductances were the same as those for the model data of Fig. 4.
Figure 7
Figure 7. Effects of α-DTX on membrane potential
α-DTX has no effect on membrane potential in the resting range but depolarizes the neurons if applied at potentials more positive than −50 mV. The change from the resting potential upon application of α-DTX (50 nm) is plotted against the resting membrane potential, n = 28 (▪). The effects of α-DTX for 5 neurons (▾, ▴, •, ♦ and ◂) held (via current injection) at more depolarized potentials are also shown. The lines demarcate the change in the resting potential upon removal of the α-DTX-sensitive current (Idtx) as demonstrated by the model. The upper line corresponds to a maximum whole-cell conductance of 15 nS for Idtx, while the lower corresponds to 7.5 nS.
Figure 8
Figure 8. Effect of α-DTX on the action potentials of A- and C-type neurons
The left panels show experimental data for an A-type neuron (A) depolarized from −65 mV using a 60 pA step current and a C-type neuron (B) depolarized from −66 mV with a 50 pA step current. The right panels present simulation data for an A-type model neuron using a 50 pA step current (C) and a C-type model neuron using a 20 pA step current (D). For all traces, the dotted lines present the neuron responses to the same step current magnitudes as in control conditions but in the presence of α-DTX. Arrows indicate the start of the current injection.
Figure 9
Figure 9. α-DTX increases excitability in C-type neurons
A, on the left is shown the discharge of a C-type neuron in response to 80, 200 and 280 pA current steps from a resting membrane potential of approximately −70 mV under control conditions (continuous line) and in the presence of α-DTX (dotted line). On the right is shown a C-type model neuron configured to match the resting membrane potential and action potential discharge properties of the control cell. Simulation results present discharge in response to 15, 60 and 100 pA current steps under control conditions (continuous line) and with gdtx equal to zero to simulate the application of α-DTX (dotted line). Maximum whole-cell K+ conductances were as follows (all in nS): gdtx = 12.5, g4-AP = 30, gK,Ca = 30 and gK = 15. For all traces the horizontal and vertical scale bars correspond to 250 ms and 60 mV, respectively. B, occurrence of action potentials in response to a step depolarizing current in control solution (closed symbols) and in the presence of α-DTX (open symbols) for 3 C-type neurons (upper panel) that fired only a single action potential before addition of α-DTX and two neurons (lower panel) that fired with a burst before α-DTX.
Figure 10
Figure 10. α-DTX increases firing frequency in A-type neuron
Top panel, discharge of an A-type neuron in response to a 100 pA current step from a resting membrane potential of −58 mV under control conditions (continuous line) and in the presence of α-DTX (dotted line). Bottom panel, A-type model neuron configured to match the resting membrane potential and action potential discharge properties of the control cell. Simulation results present discharge in response to a 70 pA current step under control conditions (continuous line) and with gdtx equal to zero to simulate the application of α-DTX (dotted line). Maximum whole-cell K+ conductances were as follows (all in nS): gdtx = 7.5, g4-AP = 40, gK,Ca = 2.0 and gK = 12.5.
Figure 11
Figure 11. Time course of outward K+ currents in model A- and C-type neurons
The 4 major K+ current components from A-type (A and B) and C-type model neurons (C and D) under control conditions (A and C) and after the removal of Idtx (B and D). The C-type and A-type models utilized the same values of parameters for the model data presented in Figs 9 and 10, respectively. Corresponding A-type and C-type action potentials evoked using a 60 and 40 pA, respectively, step current injection are shown above for reference. Action potential calibration bars, 10 ms, 40 mV.

Similar articles

Cited by

References

    1. Agostoni E, Chinnock JE, DeBurgh Daly M, Murray JG. Functional and histological studies of the vagus nerve and its branches to the heart, lungs and abdominal viscera in the cat. Journal of Physiology. 1957;135:182–205. - PMC - PubMed
    1. Amir R, Devor M. Functional cross-excitation between afferent A- and C-neurons in dorsal root ganglia. Neuroscience. 2000;95:189–195. - PubMed
    1. Belmonte C, Gallego R. Membrane properties of cat sensory neurones with chemoreceptor and baroreceptor endings. Journal of Physiology. 1983;342:603–614. - PMC - PubMed
    1. Bertoli A, Moran O, Conti F. Activation and deactivation properties of rat brain K channels of the Shaker-related family. European Biophysical Journal. 1994;23:379–384. - PubMed
    1. Christie MJ, Adelman JP, Douglass J, North RA. Expression of a cloned rat brain potassium channel in xenopous oocytes. Science. 1989;244:221–224. - PubMed

MeSH terms

LinkOut - more resources