. 2002 Jun 1;541(Pt 2):529-43.
doi: 10.1113/jphysiol.2001.013438.

Molecular aspects of acute inhibition of Na(+)-H(+) exchanger NHE3 by A(2)-adenosine receptor agonists

Affiliations

Molecular aspects of acute inhibition of Na(+)-H(+) exchanger NHE3 by A(2)-adenosine receptor agonists

Francesca Di Sole et al. J Physiol. .

Abstract

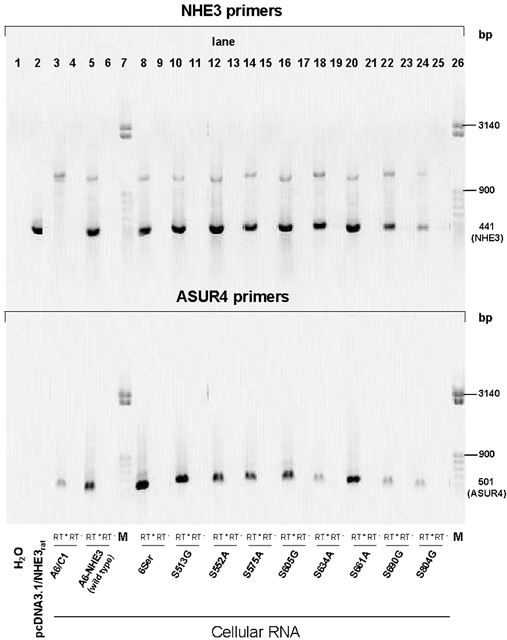
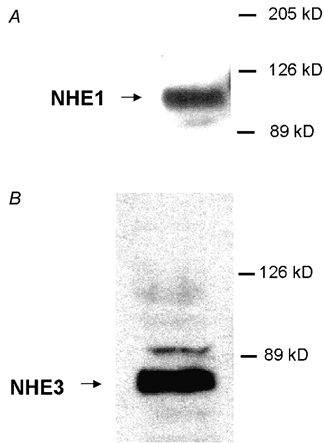
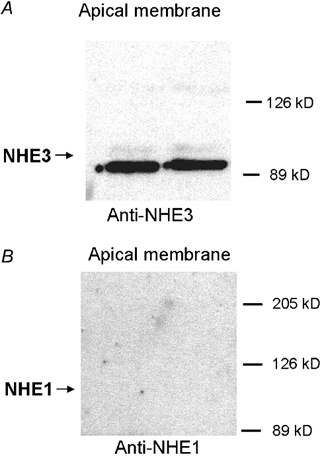
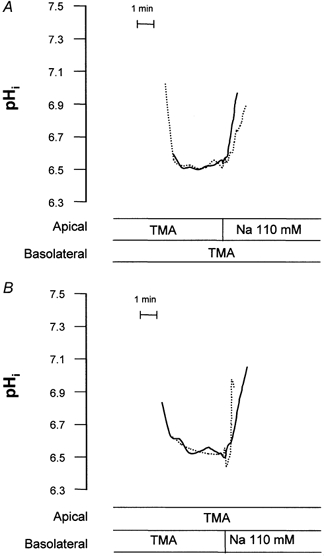
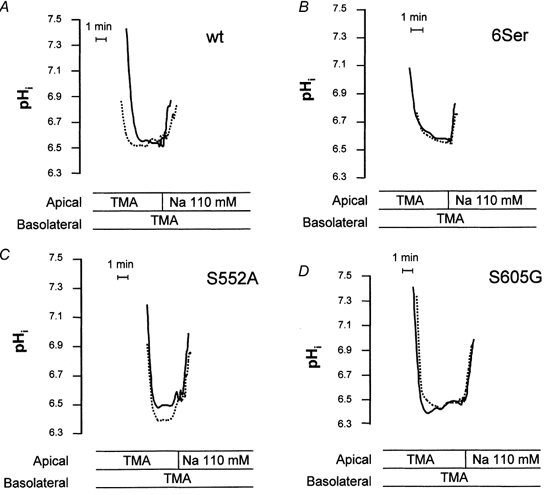
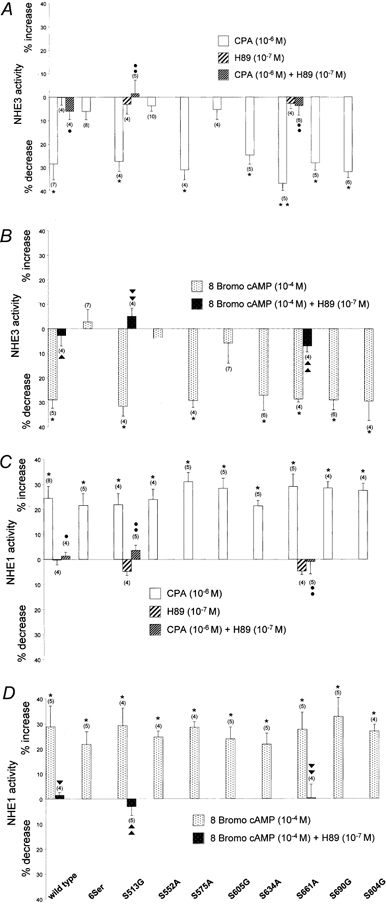
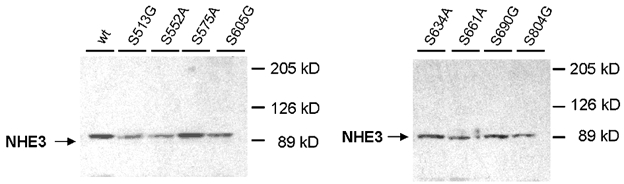
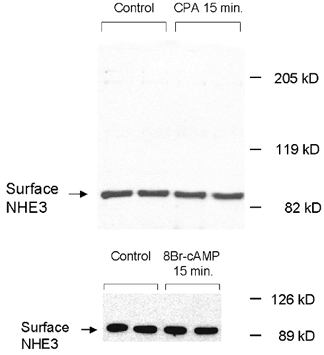
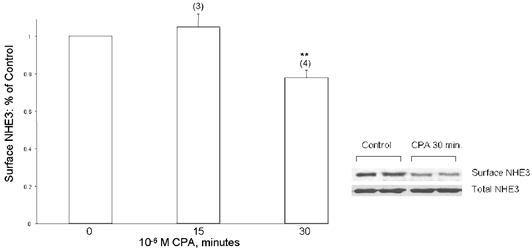
Adenosine regulates Na(+) homeostasis by its acute effects on renal Na(+) transport. We have shown in heterologously transfected A6/C1 cells (renal cell line from Xenopus laevis) that adenosine-induced natriuresis may be effected partly via A(2) adenosine receptor-mediated inactivation of the renal brush border membrane Na(+)-H(+) exchanger NHE3. In this study we utilized A6/C1 cells stably expressing wild-type as well as mutated forms of NHE3 to assess the molecular mechanism underlying A(2)-dependent control of NHE3 function. Cell surface biotinylation combined with immunoprecipitation revealed that NHE3 is targeted exclusively to the apical domain and that the endogenous Xenopus NHE is located entirely on the basolateral side of A6/C1 transfectants. Stimulation of A(2)-adenosine receptors located on the basolateral side for 15 min with CPA (N6-cyclopentyladenosine) acutely decreased NHE3 activity (microspectrofluorimety). This effect was mimicked by 8-bromo-cAMP and entirely blocked by pharmacological inhibition of PKA (with H89) or singular substitution of two PKA target sites (serine 552 and serine 605) on NHE3. Downregulation of NHE3 activity by CPA was attributable to a reduction of NHE3 intrinsic transport activity without change in surface NHE3 protein at 15 min. At 30 min, the decrease in transport activity was associated with a decrease in apical membrane NHE3 antigen. In conclusion, two highly conserved target serine sites on NHE3 determine NHE3 modulation upon A(2)-receptor activation and NHE3 inactivation by adenosine proceeds via two phases with distinct mechanisms.


Figures

Figure 1
Figure 1. Expression of NHE3 transcripts in A6/C1 cell lines
Transcripts were detected by RT-PCR as described in text. Total RNA was extracted from untransfected A6/C1 cells, A6/C1 cells transfected with wild-type NHE3 or mutated forms of NHE3 and used as a template for RT-PCR with primers specific for rat NHE3 (top panel) or the amino acid permease-related protein ASUR4 (control, bottom panel). Single products were amplified for all primer pairs with expected sizes indicated in the margin (NHE3, 441 bp; ASUR4, 501 bp). H2O: PCR performed with no template. pcDNA3.1/NHE3rat: PCR reaction performed with linearised expression plasmid containing the full sequence of rat NHE3. All other reactions are RT-PCR from cellular RNA. A6/C1, untransfected A6/C1 cells; A6-NHE3, transfected with WT NHE3. A6/C1 cells transfected with mutant NHE3, with various substitution of serine residues on the cytoplasmic domain of NHE3 as given in Table 1. M, migration of size standards (50 bp step ladder from Sigma, Deisenhofen, Germany); RT+/RT, RT reactions performed in the presence/absence of reverse transcriptase. Results are representative for three independent experiments.
Figure 2
Figure 2. Analysis of NHE protein expression in A6/C1 cells transfected with wild-type NHE3: typical immunoblot
Membrane proteins (30 μg) of A6/C1 transfectants were resolved by SDS-PAGE, and probed for NHE1 or NHE3 antigen using polyclonal antibodies raised against the C-terminal 157 amino acids of the human NHE1 isoform (A) or against amino acids 822-835 of the rat NHE3 isoform (B). The expected mobility of the NHE proteins are indicated by the arrow. Each of the figures is representative of three independent experiments.
Figure 3
Figure 3. Analysis of expression of NHE protein in the apical membrane of A6/C1 cells transfected with wild-type NHE3: typical immunoblot
Apical surface proteins of confluent A6/C1 transfectants on permeable membranes selectively biotinylated from the apical surface and retrieved from solubilised cell lysate by streptavidin-affinity precipitation. Biotinylated proteins were size fractionated by SDS-PAGE, blotted onto nitrocellulose, and probed with antibodies specific for the C-terminal domain of the rat NHE3 isoform using ECL (A), and reprobed for NHE1 using the polyclonal anti-human NHE1 antibodies (B). The expected mobility of NHE proteins are indicated by arrows. Each blot is representative of three independent experiments, where determination of NHE3 and NHE1 antigenicity was carried out in two populations A6/C1 transfectants of the same passage.
Figure 4
Figure 4. Modulation of apical and basolateral Na+-H+ exchange activity in A6/C1 cells expressing wild-type NHE3 by CPA
Na+-H+ exchange activity was measured fluorimetrically as Na+-induced alkalinization (independent apical vs. basolateral Na+ addition) after an acid load (NH4Cl pulse/withdrawal). Pair-wise comparisons of NHE activity were made before and after addition of basolateral CPA. Onset of tracing is when cells were switched to Na+-free perfusion medium after an NH4Cl pulse. pHi tracings measured with or without agonist are superimposed. A, representative tracings of pHi mediated by apical NHE3 in the absence (continuous line) or presence of basolateral CPA (dotted line). B, representative tracings of pHi mediated by basolateral NHE1 in the absence (continuous line) or presence of basolateral CPA (dotted line). Examples given represent the effect of a 15 min 10−6m basolateral CPA.
Figure 5
Figure 5. CPA-induced modulation of the activity of wild-type NHE3 and selected mutated forms of NHE3
Na+-H+ exchange activity was measured fluorimetrically as Na+-induced alkalinization (independent apical vs. basolateral Na+ addition) after an acid load (NH4 Cl pulse/withdrawal). Pair-wise comparisons of NHE activity were made before and after addition of basolateral 10−6m CPA (15 min). Onset of tracing is when cells were switched to Na+-free perfusion medium after an NH4Cl pulse. pHi tracings measured with or without agonist are superimposed. A, representative tracings from A6/C1 cells stably transfected with WT NHE. B, C and D, representative tracings from A6/C1 cells stably transfected with mutant forms of NHE3.
Figure 6
Figure 6. Summary of effect of CPA and 8-bromo-cAMP in the absence, and where indicated in the presence of H89 on NHE activities in A6/C1 cells transfected with wild- type NHE3 and mutant forms of NHE3
The effect of CPA and 8-br-cAMP with or without H89 on NHE activities was assayed fluorimetrically as Na+-induced alkalinization (independent apical vs. basolateral Na+ addition) after an acid load (NH4Cl pulse/withdrawal). Pair-wise comparisons of NHE activity were made before and after addition of agonists. Exposure to agonists were as follows: basolateral CPA, 10−6m for a 15 min period; apical and basolateral 8-br-cAMP, 10−4m for a 15 min period; apical and basolateral H89, 10−6m for a 15 min period in either the absence or presence of PKA agonists (that were applied to the basolateral or apical and basolateral aspect of A6/C1 cells as indicated above). A, summary of experiments evaluating the effect of CPA, H89 and CPA plus H89 on NHE3 activity in A6/C1 cell transfectants. B, summary of effect of 8-br-cAMP and 8-br-cAMP plus H89 on NHE3 activity of transfected A6/C1 cell lines. C, summary of effect of CPA, H89 and CPA plus H89 on endogenous NHE1 activity. D, summary of effect of 8-br-cAMP and 8-br-cAMP plus H89 on basolateral NHE1 activity. Means ±s.e.m. of changes of NHE activity with agonists are presented. The number of experiments performed under identical experimental conditions is given in parentheses. *P < 0.05, treated versus control; •, P < 0.05, treated with CPA plus H89 versus treated with CPA; ▾, P < 0.05 treated with 8-br-cAMP plus H89 versus treated with 8-br-cAMP.
Figure 7
Figure 7. Analysis of protein expression from A6/C1 cells expressing wild-type and mutant NHE3s
The level of protein expression of wild type (WT) and mutant NHE3 was determined by immunoblot. 30 μg of membrane protein from each cell line was resolved by SDS-PAGE, transferred onto nitrocellulose filters and probed with antibodies specific for the C-terminal domain of the human NHE3 isoform using ECL. Abbreviations in the figure are used to refer to the various NHE3 constructs transfected into A6/C1 cells and are those given in Table 1. Two independent experiments showed similar results.
Figure 8
Figure 8. Apical membrane NHE3 abundance in response to 15 min CPA or 8-br-cAMP
Confluent cells on permeable support were selectively biotinylated on the apical surface after agonists addition (basolateral CPA 10−6m; 8-br-cAMP 10−4m, 15 min) and biotinylated proteins were precipitated with steptavidin-bound agarose and NHE3 abundance was measured by immunoblot using antibodies specific for the C-terminal domain of the rat NHE3 isoform. A, effect of CPA on biotin-accessible NHE3 surface antigen in the apical membrane of A6/C1 cells stably transfected with (WT) NHE3. B, effect of 8-br-cAMP on plasmalemmal NHE3 antigen of the same cell line. Three independent experiments showed similar results.
Figure 9
Figure 9. Apical membrane NHE3 protein abundance in response to either 15 or 30 min CPA
A6/C1 cells transfected with wild-type NHE3 were treated selectively on the basolateral cell surface with 10−6m CPA for the indicated period. Apical surface proteins were biotinylated and retrieved from the solubilised cell lysate by streptavidin-affinity precipitation as indicated in legend of Fig. 8, and NHE3 antigen was quantified by immunoblot. Total NHE3 was quantified by immunoblotting NHE3 from the crude membrane fractions. Graph is a summary of all experiments (number of experiments given in parentheses). Error bars indicate means and s.e.m. * P < 0.05 compared with control (vehicle-treated cells). The inset is a typical blot from an experiment where effect of CPA (10−6m, 30 min) on surface NHE3 abundance was studied (upper panel) and compared with change of total NHE3 within the experimental period (lower panel).

Similar articles

Cited by

References

    1. Amemiya M, Loffing J, Lötscher M, Kaissling B, Alpern RJ, Moe OW. Expression of NHE-3 in the apical membrane of rat renal proximal tubule and thick ascending limb. Kidney International. 1995;48:1206–1215. - PubMed
    1. Aronson PS. Role of ion exchangers in mediating NaCl transport in the proximal tubule. Kidney International. 1996;49:1665–1670. - PubMed
    1. Beach RE, Good DW. Effects of adenosine on ion transport in rat medullary thick ascending limb. American Journal of Physiology. 1992;263:F482–487. - PubMed
    1. Casavola V, Guerra L, Reshkin SJ, Jacobson KA, Murer H. Polarization of adenosine effects on intracellular pH in A6 renal epithelial cells. Molecular Pharmacology. 1997;51:516–523. - PMC - PubMed
    1. Chambrey R, Warnock DG, Podevin R-A, Bruneval P, Mandet C, Bélair M-F, Bariéty J, Paillard M. Immunolocalization of the Na+/H+ exchanger isoform NHE2 in rat kidney. American Journal of Physiology. 1998;275:F379–386. - PubMed

Publication types

MeSH terms

LinkOut - more resources