. 2002 Jun 1;541(Pt 2):601-12.
doi: 10.1113/jphysiol.2001.016212.

Topographic reorganization in area 18 of adult cats following circumscribed monocular retinal lesions in adolescence

Affiliations

Topographic reorganization in area 18 of adult cats following circumscribed monocular retinal lesions in adolescence

J M Young et al. J Physiol. .

Abstract

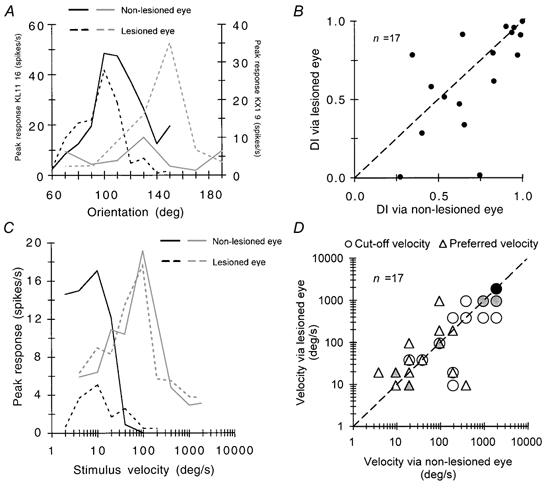
Circumscribed laser lesions were made in the nasal retinae of one eye in adolescent cats. Ten to sixteen months later, about 80 % of single neurones recorded in the lesion projection zone (LPZ) of contralateral area 18 (parastriate cortex, area V2) were binocular but when stimulated via the lesioned eye had ectopic discharge fields (displaced to normal retina in the vicinity of the lesion). Although the clear majority of binocular cells recorded from the LPZ responded with higher peak discharge rates to stimuli presented via the non-lesioned eye, the orientation and direction selectivities as well as preferred and upper cut-off velocities for stimuli presented through either eye were very similar. Furthermore, the sizes of the ectopic discharge fields of binocular cells recorded from the LPZ were not significantly different from those of their counterparts plotted via the non-lesioned eye. Thus, monocular retinal lesions performed in adolescent cats induce topographic reorganization in the LPZ of area 18. Although a similar reorganization occurs in area 17 (striate cortex, area V1) of cats in which monocular retinal lesions were made either in adulthood or adolescence, in view of the very different velocity response profiles of ectopic discharge fields in areas 17 and those in area 18, it appears that ectopic discharge fields in area 17 are largely independent of excitatory feedback input from area 18.


Figures

Figure 1
Figure 1. Discharge fields of neurones recorded from the LPZ of area 18
A, dorsolateral view of the cat brain with the locations of cytoarchitectonic areas 17, 18 and 19 indicated (after Tusa et al. 1978, 1979). B, average position of the LPZ in area 18 viewed in a coronal section (Horsley-Clarke anterior 2.5) through areas 17, 18 and 19. C and D, plots on the tangent screen of the outlines of ectopic and normal discharge fields (DFs) of binocular neurones recorded from the lesion projection zone (LPZ) in area 18 of the cat. C, left, the outline of the retinal lesion in the left eye of cat KL11 and the outlines of DFs (plotted via the lesioned eye) of single neurones recorded from the LPZ of area 18 of this cat. LAC; the left area centralis. Right, the outline of the retinal lesion in the left eye projected onto the right retina (grey dashed line) and the outlines of the normal corresponding DFs of single binocular neurones recorded from the LPZ of area 18 of cat KL11. RAC, the right area centralis. D, equivalent to C but for cat KR14. The smaller circles in both C and D indicate the approximate centres of DFs of neurones for which the signal-to-noise ratio of the response was not sufficient to plot the entire DF. Note that in C, cell 10 exhibited two spatially separated sub-fields (10a, ON discharge region and 10b, OFF discharge region) when stimulated via the non-lesioned (right) eye. These sub-fields were not apparent when the stimuli were presented via the lesioned (left) eye. By contrast, in D the DFs of units 16 and 20 consisted of two spatially distinct sub-fields when they were stimulated via the lesioned (left) eye and these sub-fields were not apparent when the cells were stimulated via the non-lesioned (right) eye. The radii of the larger circles on the right in both C and D indicate the expected average incongruity of DF positions, estimated from incongruity values of binocular cells recorded in area 18 of normal cats (cf. Ferster, 1981).
Figure 2
Figure 2. Discharge field incongruities and peristimulus time histograms of binocular cells in the LPZ of area 18
A, percentage histogram of discharge field incongruities of binocular neurones recorded from area 18 of normal cats (filled columns, modified from Ferster, 1981) and from the LPZ of area 18 following a monocular circumscribed retinal lesion (open columns, present study). B, peristimulus time histograms of a binocular neurone (KX1 16) recorded from the LPZ of area 18 to an optimally oriented light bar (7.4 deg × 1.4 deg) moving at the indicated velocities and presented via the non-lesioned (left, ipsilateral) or lesioned (right, contralateral) eye. The duration of recording is shown on the abscissa, the centre of which marks the change in stimulus direction. The period of stimulus movement is indicated (filled bar) as is the period when the stimulus remains stationary outside the discharge field (open bar), which was increased in proportion to the stimulus velocity. Note that the cell responds at a wide range of stimulus velocities irrespective of the eye through which the stimuli are presented. Furthermore, the cell is a class 2 cell since it responds more vigorously to stimuli presented via the contralateral eye.
Figure 3
Figure 3. Ocular dominance, peak discharge rates and discharge field areas of binocular cells in the LPZ of area 18
A, percentage bar graph of eye dominance classes for single neurones recorded in either the LPZ of area 18 in monocularly lesioned cats (hatched columns) or the topographically corresponding region of area 18 in normal cats (filled columns). Data for non-lesioned cats were taken from Dreher et al. (1992). Monocular cells were classified as either class 1 or class 5 depending upon whether the excitatory responses could be evoked by stimuli presented via the contralateral (lesioned) eye or via the ipsilateral (non-lesioned) eye, respectively. Neurones categorized as class 2 or 4 were binocular cells dominated respectively by the contralateral (lesioned) or ipsilateral (non-lesioned) eye. Neurones that responded equally well to visual stimulation via either eye were categorized as class 3 cells. Note that in both populations the clear majority of neurones were binocular (classes 2, 3 and 4). In view of the relatively small number of cells recorded from the LPZ of area 18, for the purpose of statistical analysis the neurones recorded from the LPZ of area 18 of lesioned animals and those recorded from area 18 of normal cats were divided into two rather than five eye dominance groups. One group consisted of all cells categorized as eye dominance class 1, 2 or 3 while the other group consisted of all cells categorized as eye dominance class 4 or 5. This division separates area 18 cells into those dominated or driven exclusively by the contralateral (lesioned eye) and those dominated or driven exclusively by the ipsilateral (non-lesioned) eye. Such grouping of eye dominance classes reveals a highly significant difference (P < 0.002; χ2 test, two-tailed criterion) between the samples of area 18 cells recorded in normal animals and in the LPZ of area 18 of lesioned animals. An alternative grouping of eye dominance classes in which one eye dominance group consisted of all cells categorized as eye dominance class 1 or 2 while the other group consisted of all cells categorized as eye dominance class 3, 4 or 5 also reveals a significant difference between the sample of area 18 cells recorded in normal animals and that recorded from the LPZ of lesioned animals (P < 0.02; χ2 test, two-tailed criterion). B, pairwise comparisons of the peak discharge rates of binocular neurones in the LPZ of area 18 in monocularly lesioned cats for stimuli presented via either eye. Note that for about half the neurones, the peak discharge rates for stimuli presented via the non-lesioned (ipsilateral) eye were substantially higher than those for stimuli presented via the lesioned (contralateral) eye and for only a small proportion of neurones the peak discharge rates for stimuli presented via lesioned eye were substantially higher than those for stimuli presented via the normal eye. The difference between the two populations is statistically significant (P = 0.05, Wilcoxon's matched-pairs, signed-ranks test). C, pairwise comparisons of the sizes of discharge fields (DFs) of binocular neurones in the LPZ of area 18 in monocularly lesioned cats for stimuli presented via either eye. Note that for the majority of binocular neurones recorded from the LPZ, the DFs were smaller when the stimuli were presented via the lesioned eye. The difference between the two populations was, however, not statistically significant (P > 0.05, Wilcoxon's matched-pairs, signed-ranks test).
Figure 4
Figure 4. Orientation, direction and velocity-tuning of binocular cells in the LPZ of area 18
A, orientation tuning of LPZ neurones KL11 16 (black continuous and dashed lines, see Fig. 1C) and KX1 9 (grey continuous and dashed lines) for stimuli presented via the non-lesioned and lesioned eye. The peak response of each neurone to moving bars of preferred size and velocity at various orientations is shown. The specific orientations tested are indicated as the point at which each line deflects. Note that each neurone's orientation preference did not vary substantially depending on the eye to which the stimuli were presented. Note different scales for units KL11 16 (left) and KX1 9 (right). B, pairwise comparisons of the direction selectivity indices (DIs, measured at optimal velocities) of binocular neurones in the LPZ of area 18 in monocularly lesioned cats for stimuli presented via either eye. Note that for about half the cells there are substantial differences in the DIs for stimuli presented through either eye. The difference between the two populations is, however, not statistically significant (P > 0.05, Wilcoxon's matched-pairs, signed-ranks test). C, velocity tuning curves for neurones KL11 7 (black continuous and dashed lines, see Fig 1C) and KX1 16 (grey continuous and dashed lines). Note also that despite the substantially weaker responses of neurone KL11 7 to stimuli presented via the lesioned eye (class 4 cell) the velocity-tuning curves are almost identical, irrespective of the eye (lesioned or non-lesioned) through which the stimuli are presented. D, pairwise comparisons of preferred (triangles) and cut-off velocities (circles) of binocular neurones recorded from the LPZ/FPZ of area 18. Grey triangles indicate two cells with the same preferred velocities. Grey circles indicate two cells with the same cut-off velocities while the black circle indicates three cells with the same cut-off velocities. The preferred velocity was determined as the velocity at which an optimally oriented stimulus gave the maximum response (highest peak discharge rate). The cut-off velocity was defined as the upper velocity limit at which an optimally oriented stimulus gave an excitatory response. There was no significant difference between the preferred or cut-off stimulus velocities for stimuli presented via the lesioned (contralateral) eye and those for stimuli presented via the non-lesioned (ipsilateral) eye (P > 0.05, Wilcoxon's matched-pairs, signed-ranks test).

Similar articles

Cited by

References

    1. Albus K. A quantitative study of the projection area of the central and the paracentral visual field in area 17 of the cat. I. The precision of the topography. Experimental Brain Research. 1975;24:159–179. - PubMed
    1. Alonso JM, Cudeiro J, Pérez R, Gonzalez F, Acuña C. Influence of layer V of area 18 of the cat visual cortex on responses of cells in layer V of area 17 to stimuli of high velocity. Experimental Brain Research. 1993a;93:363–366. - PubMed
    1. Alonso JM, Cudeiro J, Pérez R, Gonzalez F, Acuña C. Orientational influences of layer V of visual area 18 upon cells in layer V of area 17 in the cat cortex. Experimental Brain Research. 1993b;96:212–220. - PubMed
    1. Barlow HB, Blakemore C, Pettigrew JD. The neural mechanism of binocular depth discrimination. Journal of Physiology. 1967;193:327–342. - PMC - PubMed
    1. Berardi N, Bisti S, Cattanneo A, Fiorentini A, Maffei L. Correlation between the preferred orientation and spatial frequency of neurones in visual areas 17 and 18 of the cat. Journal of Physiology. 1982;323:603–618. - PMC - PubMed

Publication types

LinkOut - more resources