Comparative Study
. 2002 Jun;12(6):885-93.
doi: 10.1101/gr.227202.

Pattern of organization of human mitochondrial pseudogenes in the nuclear genome

Affiliations
Comparative Study

Pattern of organization of human mitochondrial pseudogenes in the nuclear genome

Markus Woischnik et al. Genome Res. 2002 Jun.

Abstract

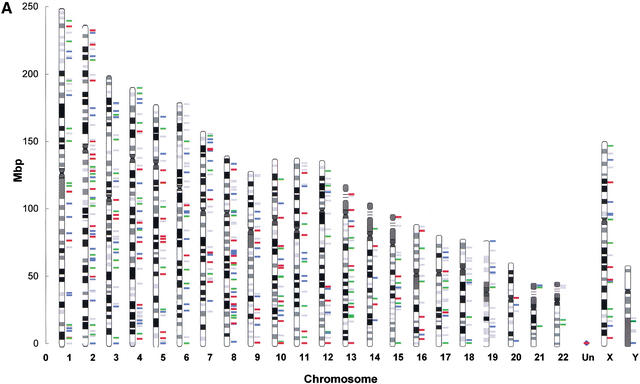
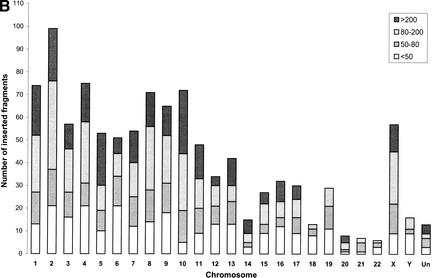
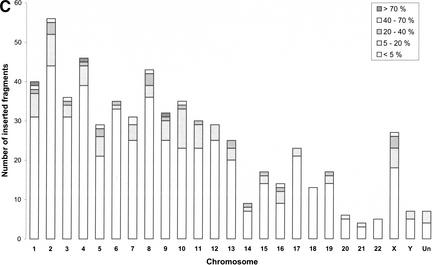
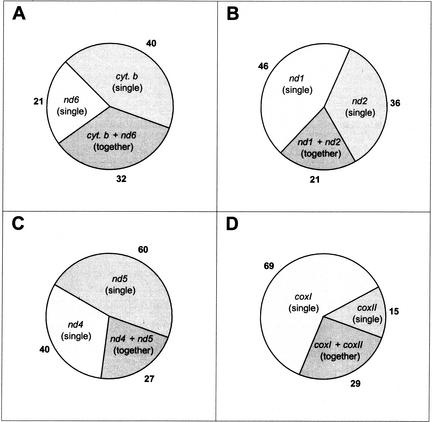
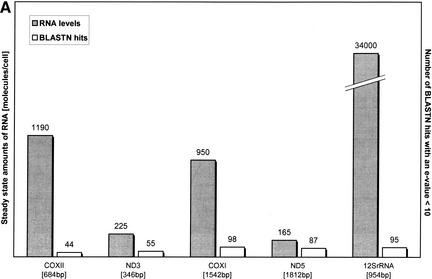
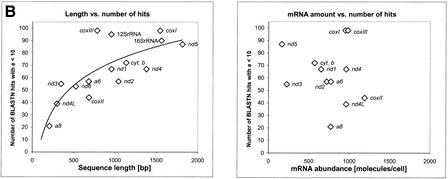
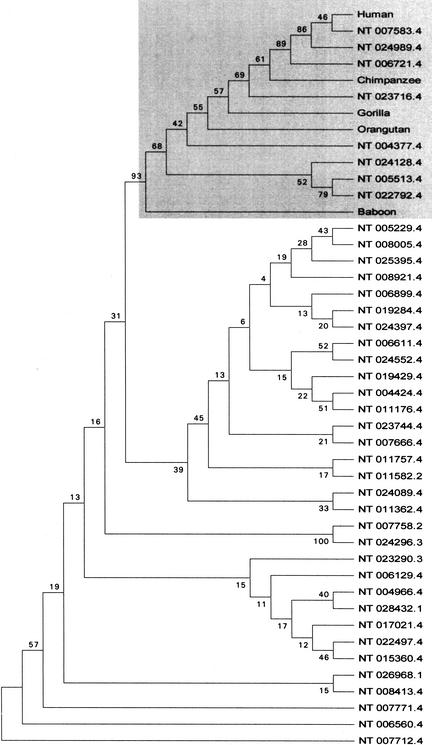
Mitochondrial pseudogenes in the human nuclear genome have been previously described, mostly as a source of artifacts during the analysis of the mitochondrial genome. With the availability of the complete human genome sequence, we performed a comprehensive analysis of mtDNA insertions into the nucleus. We found 612 independent integrations that are evenly distributed among all chromosomes as well as within each individual chromosome. The identified pseudogenes account for a content of at least 0.016% of the human nuclear DNA. Up to 30% of a chromosome's mtDNA pseudogene content is composed of fragments that encompass two or more adjacent mitochondrial genes, and we found no correlation between the abundance of mitochondrial transcripts and the multiplicity of integrations. These observations indicate that the migrations of mitochondrial DNA sequences to the nucleus were predominantly DNA mediated. Phylogenetic analysis of the mtDNA pseudogenes and mtDNA sequences of primates indicate a continuous transfer into the nucleus. Because of the limited window of opportunity for mtDNA transfer to the germline, sperm mtDNA, which is released from degenerating mitochondria after fertilization, could be an important source of nuclear mtDNA pseudogenes.


Figures

Figure 1
Figure 1
MtDNA pseudogenes on chromosome 2 of the public draft of the human genome. The schematic shows the arrangement of mitochondrial pseudogenes on chromosome 2 of the human genome (public draft version from July 16, 2001). Pseudogenes (protein coding genes, rRNAs, and tRNAs) are represented as arrows, the length of which corresponds to the extent of alignment of a particular pseudogene with the mtDNA equivalent as shown on the top of the map. The representation is on scale. The arrows are shaded in four different colors depending on the degree of homology. As a measure for homology we used the BLASTN scores: >200 (red), 80–200 (blue), 50–79 (green), and <50 (gray). Isolated homologs with scores <50 are just listed as numbers. For ease of orientation, regions corresponding to genes that belong to the same subunit have the same background color, that is, rRNAs and Complex I, IV, and V. A map containing the complete chromosome set can be found in the supplementary information available at http://www.genome.org.
Figure 2
Figure 2
(A) Mitochondrial pseudogene locations and chromosome gene densities. The diagram compares the location of mitochondrial pseudogenes with the known gene densities for chromosomes 1–22, X, Y, and the yet unassigned contigs (Un) of the human genome. The colored bars to the right side of the chromosomes mark the presence of mtDNA fragments that were integrated into the genome. Each bar shows a single integration event and can represent the integration of a single gene or a larger piece of mtDNA. The color of the bar is determined by the best homology that can be found within this fragment and is graded by the BLASTN score: >200 (red), 80–200 (blue), 50–79 (green), and <50 (gray).(Figure 2 continued on following page.) (B) Number of mtDNA integrations into the nucleus in relation to the degree of homology. The number of mtDNA integrations into the nucleus was calculated for each chromosome. In addition to isolated pseudogenes, every single pseudogene being part of a larger piece of integrated mtDNA was regarded as one hit. Depending on the degree of homology, the numbers were split into four groups following the grading that was used before (see Fig. 1). The height of each bar represents the sum of all unique pseudogenes on one chromosome. (C) Frequency of integration of mtDNA as a function of fragment size. The extent to which an integrated fragment covered the full-length mtDNA was calculated in percentage for each contiguous fragment of the map in Figure 1. The number of fragments covering a certain range of percentages was calculated and shown as five groups that are plotted separately for each chromosome.
Figure 2
Figure 2
(A) Mitochondrial pseudogene locations and chromosome gene densities. The diagram compares the location of mitochondrial pseudogenes with the known gene densities for chromosomes 1–22, X, Y, and the yet unassigned contigs (Un) of the human genome. The colored bars to the right side of the chromosomes mark the presence of mtDNA fragments that were integrated into the genome. Each bar shows a single integration event and can represent the integration of a single gene or a larger piece of mtDNA. The color of the bar is determined by the best homology that can be found within this fragment and is graded by the BLASTN score: >200 (red), 80–200 (blue), 50–79 (green), and <50 (gray).(Figure 2 continued on following page.) (B) Number of mtDNA integrations into the nucleus in relation to the degree of homology. The number of mtDNA integrations into the nucleus was calculated for each chromosome. In addition to isolated pseudogenes, every single pseudogene being part of a larger piece of integrated mtDNA was regarded as one hit. Depending on the degree of homology, the numbers were split into four groups following the grading that was used before (see Fig. 1). The height of each bar represents the sum of all unique pseudogenes on one chromosome. (C) Frequency of integration of mtDNA as a function of fragment size. The extent to which an integrated fragment covered the full-length mtDNA was calculated in percentage for each contiguous fragment of the map in Figure 1. The number of fragments covering a certain range of percentages was calculated and shown as five groups that are plotted separately for each chromosome.
Figure 3
Figure 3
Numbers of loci containing adjacent pseudogenes or their respective isolated entities. Certain adjacent mtDNA genes are expressed from distinct mRNA species. This is the case for the four examples shown. Panel A shows the number of integrations of isolated nd6 and cyt. b pseudogenes in comparison with the integration of fragments that contain both genes in the same arrangement to each other as in mtDNA. Panels BD show the results for the same type of analysis for the couples nd1 + nd2, nd4 + nd5, and coxI + coxII, respectively.
Figure 4
Figure 4
(A) Comparison of steady-state amounts of mitochondrial RNA and the occurrence of the corresponding pseudogene in the nuclear genome. Shown are the steady-state amounts of certain mitochondrial mRNA species and of 12S rRNA (Attardi et al. 1990) and the number of BLAST hits with an e-value <10 for that particular gene. The correlation coefficients are r = 0.87 (hits/sequence length), and r = −0.18 (hits/mRNA abundance). (B) Comparison of steady-state levels of mitochondrial mRNA and the occurrence of the corresponding pseudogene in the nuclear genome. The left chart illustrates the correlation between sequence length and the number of BLAST hits above a given threshold, with the correlation coefficient being r = 0.74. Each data point represents one of the 15 sequences of the mtDNA, including the rRNAs. On the right chart, the same number of BLAST hits as on the left chart is plotted against the steady-state levels of mitochondrial mRNA (mRNA data from Attardi et al. 1990); correlation coefficient is r = −0.11.
Figure 4
Figure 4
(A) Comparison of steady-state amounts of mitochondrial RNA and the occurrence of the corresponding pseudogene in the nuclear genome. Shown are the steady-state amounts of certain mitochondrial mRNA species and of 12S rRNA (Attardi et al. 1990) and the number of BLAST hits with an e-value <10 for that particular gene. The correlation coefficients are r = 0.87 (hits/sequence length), and r = −0.18 (hits/mRNA abundance). (B) Comparison of steady-state levels of mitochondrial mRNA and the occurrence of the corresponding pseudogene in the nuclear genome. The left chart illustrates the correlation between sequence length and the number of BLAST hits above a given threshold, with the correlation coefficient being r = 0.74. Each data point represents one of the 15 sequences of the mtDNA, including the rRNAs. On the right chart, the same number of BLAST hits as on the left chart is plotted against the steady-state levels of mitochondrial mRNA (mRNA data from Attardi et al. 1990); correlation coefficient is r = −0.11.
Figure 5
Figure 5
Consensus tree of the phylogenetic analysis of mitochondrial gene coxII and coxII pseudogenes in the human genome. Pseudogene sequences were labeled with their contig number, which can also be found in Figure 1. The tree was constructed using maximum parsimony analysis and represents the consensus tree of equally parsimonious trees. Bootstrap values, calculated from 100 repetitions, are placed at each branchpoint. A gray box is highlighting the primate branch. The following sequences were taken from the GenBank: Human (Homo sapiens, J01415), Orangutan (Pongo pygmaeus, NC001646), Chimpanzee (Pan troglodytes, D38113), Gorilla (Gorilla gorilla, D38114), and Baboon (Papio hamadryas, Y18001).

References

    1. Altschul SF, Gish W, Miller W, Myers EW, Lipman DJ. Basic local alignment search tool. J Mol Biol. 1990;215:403–410. - PubMed
    1. Arctander P. Comparison of a mitochondrial gene and a corresponding nuclear pseudogene. Proc R Soc Lond B Biol Sci. 1995;262:13–19. - PubMed
    1. Attardi G, Chomyn A, King MP, Kruse B, Polosa PL, Murdter NN. Regulation of mitochondrial gene expression in mammalian cells. Biochem Soc Trans. 1990;18:509–513. - PubMed
    1. Bensasson D, Zhang D, Hartl DL, Hewitt GM. Mitochondrial pseudogenes: Evolution's misplaced witnesses. Trends Ecol Evol. 2001;16:314–321. - PubMed
    1. Blanchard JL, Lynch M. Organellar genes: Why do they end up in the nucleus? Trends Genet. 2000;16:315–320. - PubMed

Publication types

Substances

LinkOut - more resources