Extended intermarker linkage disequilibrium in the Afrikaners
- PMID: 12045148
- PMCID: PMC548332
- DOI: 10.1101/gr.136202
Extended intermarker linkage disequilibrium in the Afrikaners
Abstract
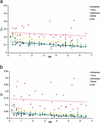
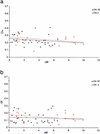
In this study we conducted an investigation of the background level of linkage disequilibrium (LD) in the Afrikaner population to evaluate the appropriateness of this genetic isolate for mapping complex traits. We analyzed intermarker LD in 62 nuclear families using microsatellite markers covering extended chromosomal regions. The markers were selected to allow the first direct comparison of long-range LD in the Afrikaners to LD in other demographic groups. Using several statistical measures, we find significant evidence for LD in the Afrikaners extending remarkably over a 6-cM range. In contrast, LD decays significantly beyond 3-cM distances in the other founder and outbred populations examined. This study strongly supports the appropriateness of the Afrikaner population for genome-wide scans that exploit LD to map common, multigenic disorders.
Figures


Similar articles
-
Significant evidence for linkage disequilibrium over a 5-cM region among Afrikaners.Genomics. 2000 May 15;66(1):87-92. doi: 10.1006/geno.2000.6190. Genomics. 2000. PMID: 10843808
-
Further evidence for linkage of Gilles de la Tourette syndrome (GTS) susceptibility loci on chromosomes 2p11, 8q22 and 11q23-24 in South African Afrikaners.Am J Med Genet. 2001 Mar 8;105(2):163-7. doi: 10.1002/ajmg.1192. Am J Med Genet. 2001. PMID: 11304830
-
Not all isolates are equal: linkage disequilibrium analysis on Xq13.3 reveals different patterns in Sardinian sub-populations.Hum Genet. 2002 Jul;111(1):9-15. doi: 10.1007/s00439-002-0753-z. Epub 2002 Jun 18. Hum Genet. 2002. PMID: 12136230
-
Accounting for linkage disequilibrium in association analysis of diverse populations.Genet Epidemiol. 2014 Apr;38(3):265-73. doi: 10.1002/gepi.21788. Epub 2014 Jan 26. Genet Epidemiol. 2014. PMID: 24464495 Review.
-
Unique disease heritage of the Dutch-German Mennonite population.Am J Med Genet A. 2008 Apr 15;146A(8):1072-87. doi: 10.1002/ajmg.a.32061. Am J Med Genet A. 2008. PMID: 18348259 Review.
Cited by
-
Extensive and breed-specific linkage disequilibrium in Canis familiaris.Genome Res. 2004 Dec;14(12):2388-96. doi: 10.1101/gr.3147604. Epub 2004 Nov 15. Genome Res. 2004. PMID: 15545498 Free PMC article.
-
Prevalence of Clinically Relevant Germline BRCA Variants in a Large Unselected South African Breast and Ovarian Cancer Cohort: A Public Sector Experience.Front Genet. 2022 Apr 8;13:834265. doi: 10.3389/fgene.2022.834265. eCollection 2022. Front Genet. 2022. PMID: 35464868 Free PMC article.
-
The extent and distribution of linkage disequilibrium in a multi-hierarchic outbred canine pedigree.Mamm Genome. 2003 Aug;14(8):555-64. doi: 10.1007/s00335-003-2272-1. Mamm Genome. 2003. PMID: 12925888
-
Modeling extent and distribution of zygotic disequilibrium: implications for a multigenerational canine pedigree.Genetics. 2006 Sep;174(1):439-53. doi: 10.1534/genetics.106.060137. Epub 2006 Jul 18. Genetics. 2006. PMID: 16849601 Free PMC article.
-
Distribution of genome-wide linkage disequilibrium based on microsatellite loci in the Samoan population.Hum Genomics. 2004 Aug;1(5):327-34. doi: 10.1186/1479-7364-1-5-327. Hum Genomics. 2004. PMID: 15588493 Free PMC article.
References
-
- Balakrishnan V, Sanghvi LD. Distance between populations on the basis of attribute data. Biometrics. 1968;24:859–865.
-
- Brink PA, Steyn LT, Coetzee GA, van der Westhuyzen DR. Familial hypercholesterolemia in South African Afrikaners. PvuII and StuI DNA polymorphisms in the LDL-receptor gene consistent with a predominating founder gene effect. Hum Genet. 1987;77:32–35. - PubMed
-
- Brink PA, Ferreira A, Moolman JC, Weymar HW, van der Merwe PL, Corfield VA. Gene for progressive familial heart block type I maps to chromosome 19q13. Circulation. 1995;91:1633–1640. - PubMed
-
- Eaves IA, Merriman TR, Barber RA, Nutland S, Tuomilehto-Wolf E, Tuomilehto J, Cucca F, Todd JA. The genetically isolated populations of Finland and Sardinia may not be a panacea for linkage disequilibrium mapping of common disease genes. Nat Genet. 2000;25:320–323. - PubMed
Publication types
MeSH terms
Substances
Grants and funding
LinkOut - more resources
Full Text Sources
Research Materials
