

CD8(+) T cell tolerance to a tumor-associated antigen is maintained at the level of expansion rather than effector function
- PMID: 12045239
- PMCID: PMC2193546
- DOI: 10.1084/jem.20011063
CD8(+) T cell tolerance to a tumor-associated antigen is maintained at the level of expansion rather than effector function
Abstract
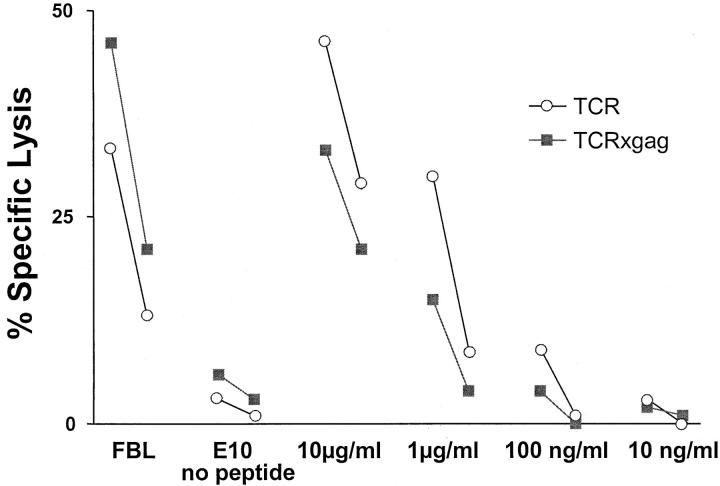
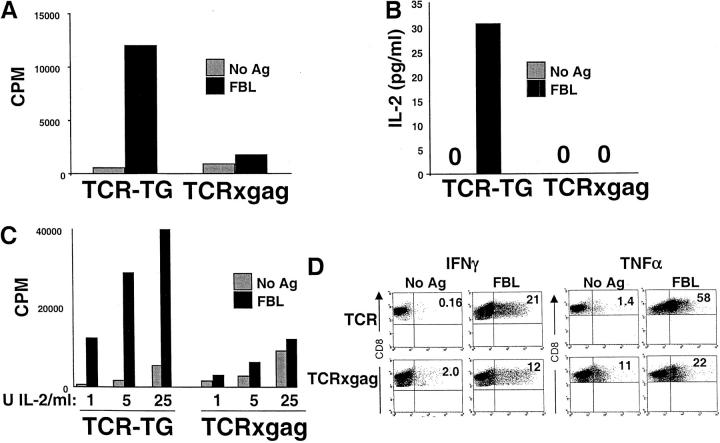
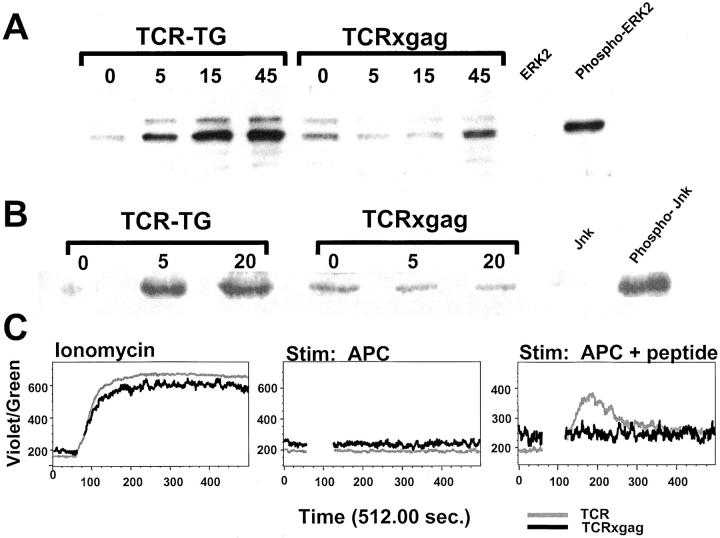
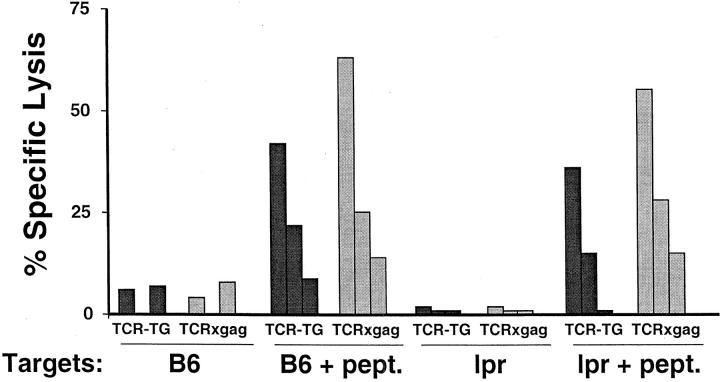
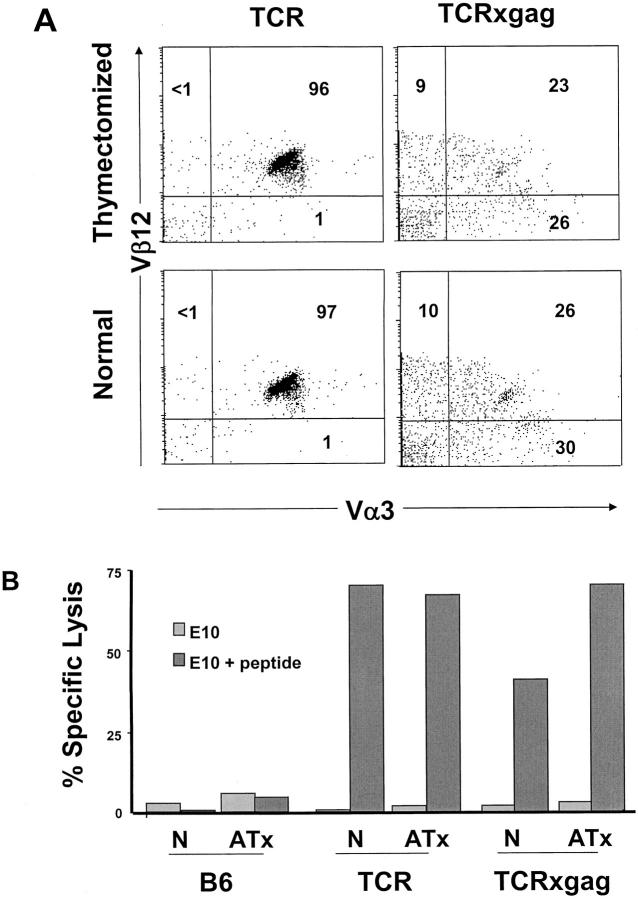
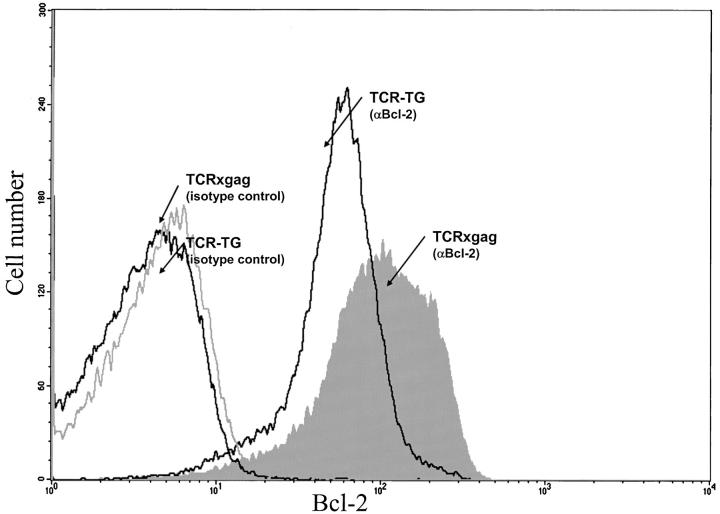
CD8+ T cell tolerance to self-proteins prevents autoimmunity but represents an obstacle to generating T cell responses to tumor-associated antigens. We have made a T cell receptor (TCR) transgenic mouse specific for a tumor antigen and crossed TCR-TG mice to transgenic mice expressing the tumor antigen in hepatocytes (gag-TG). TCRxgag mice showed no signs of autoimmunity despite persistence of high avidity transgenic CD8+ T cells in the periphery. Peripheral CD8+ T cells expressed phenotypic markers consistent with antigen encounter in vivo and had upregulated the antiapoptotic molecule Bcl-2. TCRxgag cells failed to proliferate in response to antigen but demonstrated cytolytic activity and the ability to produce interferon gamma. This split tolerance was accompanied by inhibition of Ca(2+) flux, ERK1/2, and Jun kinase phosphorylation, and a block in both interleukin 2 production and response to exogenous interleukin 2. The data suggest that proliferation and expression of specific effector functions characteristic of reactive cells are not necessarily linked in CD8+ T cell tolerance.
Figures


Similar articles
-
Death by neglect as a deletional mechanism of peripheral tolerance.Int Immunol. 1999 Aug;11(8):1225-38. doi: 10.1093/intimm/11.8.1225. Int Immunol. 1999. PMID: 10421780
-
Interleukin-15 rescues tolerant CD8+ T cells for use in adoptive immunotherapy of established tumors.Nat Med. 2006 Mar;12(3):335-41. doi: 10.1038/nm1359. Epub 2006 Feb 12. Nat Med. 2006. PMID: 16474399
-
Activation of p38 mitogen-activated protein kinase in vivo selectively induces apoptosis of CD8(+) but not CD4(+) T cells.Mol Cell Biol. 2000 Feb;20(3):936-46. doi: 10.1128/MCB.20.3.936-946.2000. Mol Cell Biol. 2000. PMID: 10629051 Free PMC article.
-
Tumor-induced disruption of proximal TCR-mediated signal transduction in tumor-infiltrating CD8+ lymphocytes inactivates antitumor effector phase.J Immunol. 2010 Dec 15;185(12):7133-40. doi: 10.4049/jimmunol.1001157. J Immunol. 2010. PMID: 21127315 Free PMC article. Review.
-
Oligoclonal expansions of antigen-specific CD8+ T cells in aged mice.Ann N Y Acad Sci. 2003 Apr;987:274-9. doi: 10.1111/j.1749-6632.2003.tb06061.x. Ann N Y Acad Sci. 2003. PMID: 12727652 Review.
Cited by
-
Durable adoptive immunotherapy for leukemia produced by manipulation of multiple regulatory pathways of CD8+ T-cell tolerance.Cancer Res. 2013 Jan 15;73(2):605-16. doi: 10.1158/0008-5472.CAN-12-2179. Epub 2012 Nov 27. Cancer Res. 2013. PMID: 23188506 Free PMC article.
-
Enhanced-affinity murine T-cell receptors for tumor/self-antigens can be safe in gene therapy despite surpassing the threshold for thymic selection.Blood. 2013 Jul 18;122(3):348-56. doi: 10.1182/blood-2013-01-478164. Epub 2013 May 14. Blood. 2013. PMID: 23673862 Free PMC article.
-
Abrogating Cbl-b in effector CD8(+) T cells improves the efficacy of adoptive therapy of leukemia in mice.J Clin Invest. 2010 Oct;120(10):3722-34. doi: 10.1172/JCI41991. Epub 2010 Sep 20. J Clin Invest. 2010. PMID: 20890046 Free PMC article.
-
Long-lasting protective antiviral immunity induced by passive immunotherapies requires both neutralizing and effector functions of the administered monoclonal antibody.J Virol. 2010 Oct;84(19):10169-81. doi: 10.1128/JVI.00568-10. Epub 2010 Jul 7. J Virol. 2010. PMID: 20610721 Free PMC article.
-
MicroRNA-150 modulates intracellular Ca 2+ levels in naïve CD8+ T cells by targeting TMEM20.Sci Rep. 2017 Jun 1;7(1):2623. doi: 10.1038/s41598-017-02697-x. Sci Rep. 2017. PMID: 28572627 Free PMC article.
References
-
- Kisielow, P., H. Bluthmann, U.D. Staerz, M. Steinmetz, and H. von Boehmer. 1988. Tolerance in T-cell-receptor transgenic mice involves deletion of nonmature CD4+8+ thymocytes. Nature. 333:742–746. - PubMed
-
- Blackman, M., J. Kappler, and P. Marrack. 1990. The role of the T cell receptor in positive and negative selection of developing T cells. Science. 248:1335–1341. - PubMed
-
- Lo, D., L.C. Burkly, G. Widera, C. Cowing, R.A. Flavell, R.D. Palmiter, and R.L. Brinster. 1988. Diabetes and tolerance in transgenic mice expressing class II MHC molecules in pancreatic β cells. Cell. 53:159–168. - PubMed
-
- Morahan, G., J. Allison, and J.F. Miller. 1989. Tolerance of class I histocompatibility antigens expressed extrathymically. Nature. 339:622–624. - PubMed
-
- Schonrich, G., F. Momburg, M. Malissen, A.M. Schmitt-Verhulst, B. Malissen, G.J. Hammerling, and B. Arnold. 1992. Distinct mechanisms of extrathymic T cell tolerance due to differential expression of self antigen. Int. Immunol. 4:581–590. - PubMed
Publication types
MeSH terms
Substances
Grants and funding
LinkOut - more resources
Full Text Sources
Other Literature Sources
Molecular Biology Databases
Research Materials
Miscellaneous
